概述
本策略通过计算黄金价格相对于21日指数移动平均线的偏离程度,结合标准差来判断市场的超买超卖情况,在偏离程度达到一定标准差时,采取趋势跟踪策略,同时设置止损机制来控制风险。
策略原理
- 计算21日指数移动平均线作为中轴
- 计算黄金价格与移动平均线的偏离度
- 对偏离度进行标准化,转换为Z-Score
- 当Z-Score上穿0.5时,做多;当Z-Score下穿-0.5时,做空
- Z-Score回落至阈值0.5/-0.5时,平仓
- Z-Score超过3/-3时,止损
优势分析
这是一个基于价格动量和标准差判断市场超买超卖的趋势跟踪策略,具有如下优势:
- 使用移动平均线作为dynamic support/resistance,能抓住趋势
- 标准差和Z-Score能很好判断超买超卖情况,降低假信号
- 采用指数移动平均线,对最近价格影响更大,更sensitive
- Z-Score标准化价格偏离度,使判断规则更统一规范
- 设置止损机制,可以及时止损,控制风险
风险分析
该策略也存在一些风险:
- 移动平均线作为判断基准,当价格出现明显跳空或突破时,会产生错误信号
- 标准差和Z-Score判断阈值需要恰当设置,过大或过小都会影响策略表现
- 止损设置不当,可能过于激进,造成不必要的亏损
- 突发事件导致价格大幅波动,会触发止损而错过趋势机会
解决方法:
1. 合理设置移动平均线参数,Identify主要趋势
2. 通过回测优化标准差参数,寻找最佳阈值
3. 设置Trailing Stop损检查策略止损合理性
4. 在事件发生后及时重新评估市场状况,调整策略参数
优化方向
该策略可以从以下几个方面进行优化:
- 利用波动率 indictor如ATR代替简单标准差,更好判定Risk appetite
- 尝试不同类型的移动平均线,寻找更合适的中轴指标
- 优化移动平均线参数,Identify最佳均线周期
- 优化Z-Score阈值,寻找最佳策略表现参数点
- 增加基于波动率的止损方式,使止损更加智能合理
总结
本策略整体来说是一个基础合理的趋势跟踪策略。它利用移动平均线判断主要趋势方向,同时通过价格偏离度的标准化处理,可以清楚判断市场的超买超卖状况,从而产生交易信号。设置合理的止损方式也使得策略在保证盈利的同时控制风险。通过进一步优化参数以及增加更多条件判断,可以使策略更加稳定可靠,具有很强的应用价值。
策略源码
/*backtest
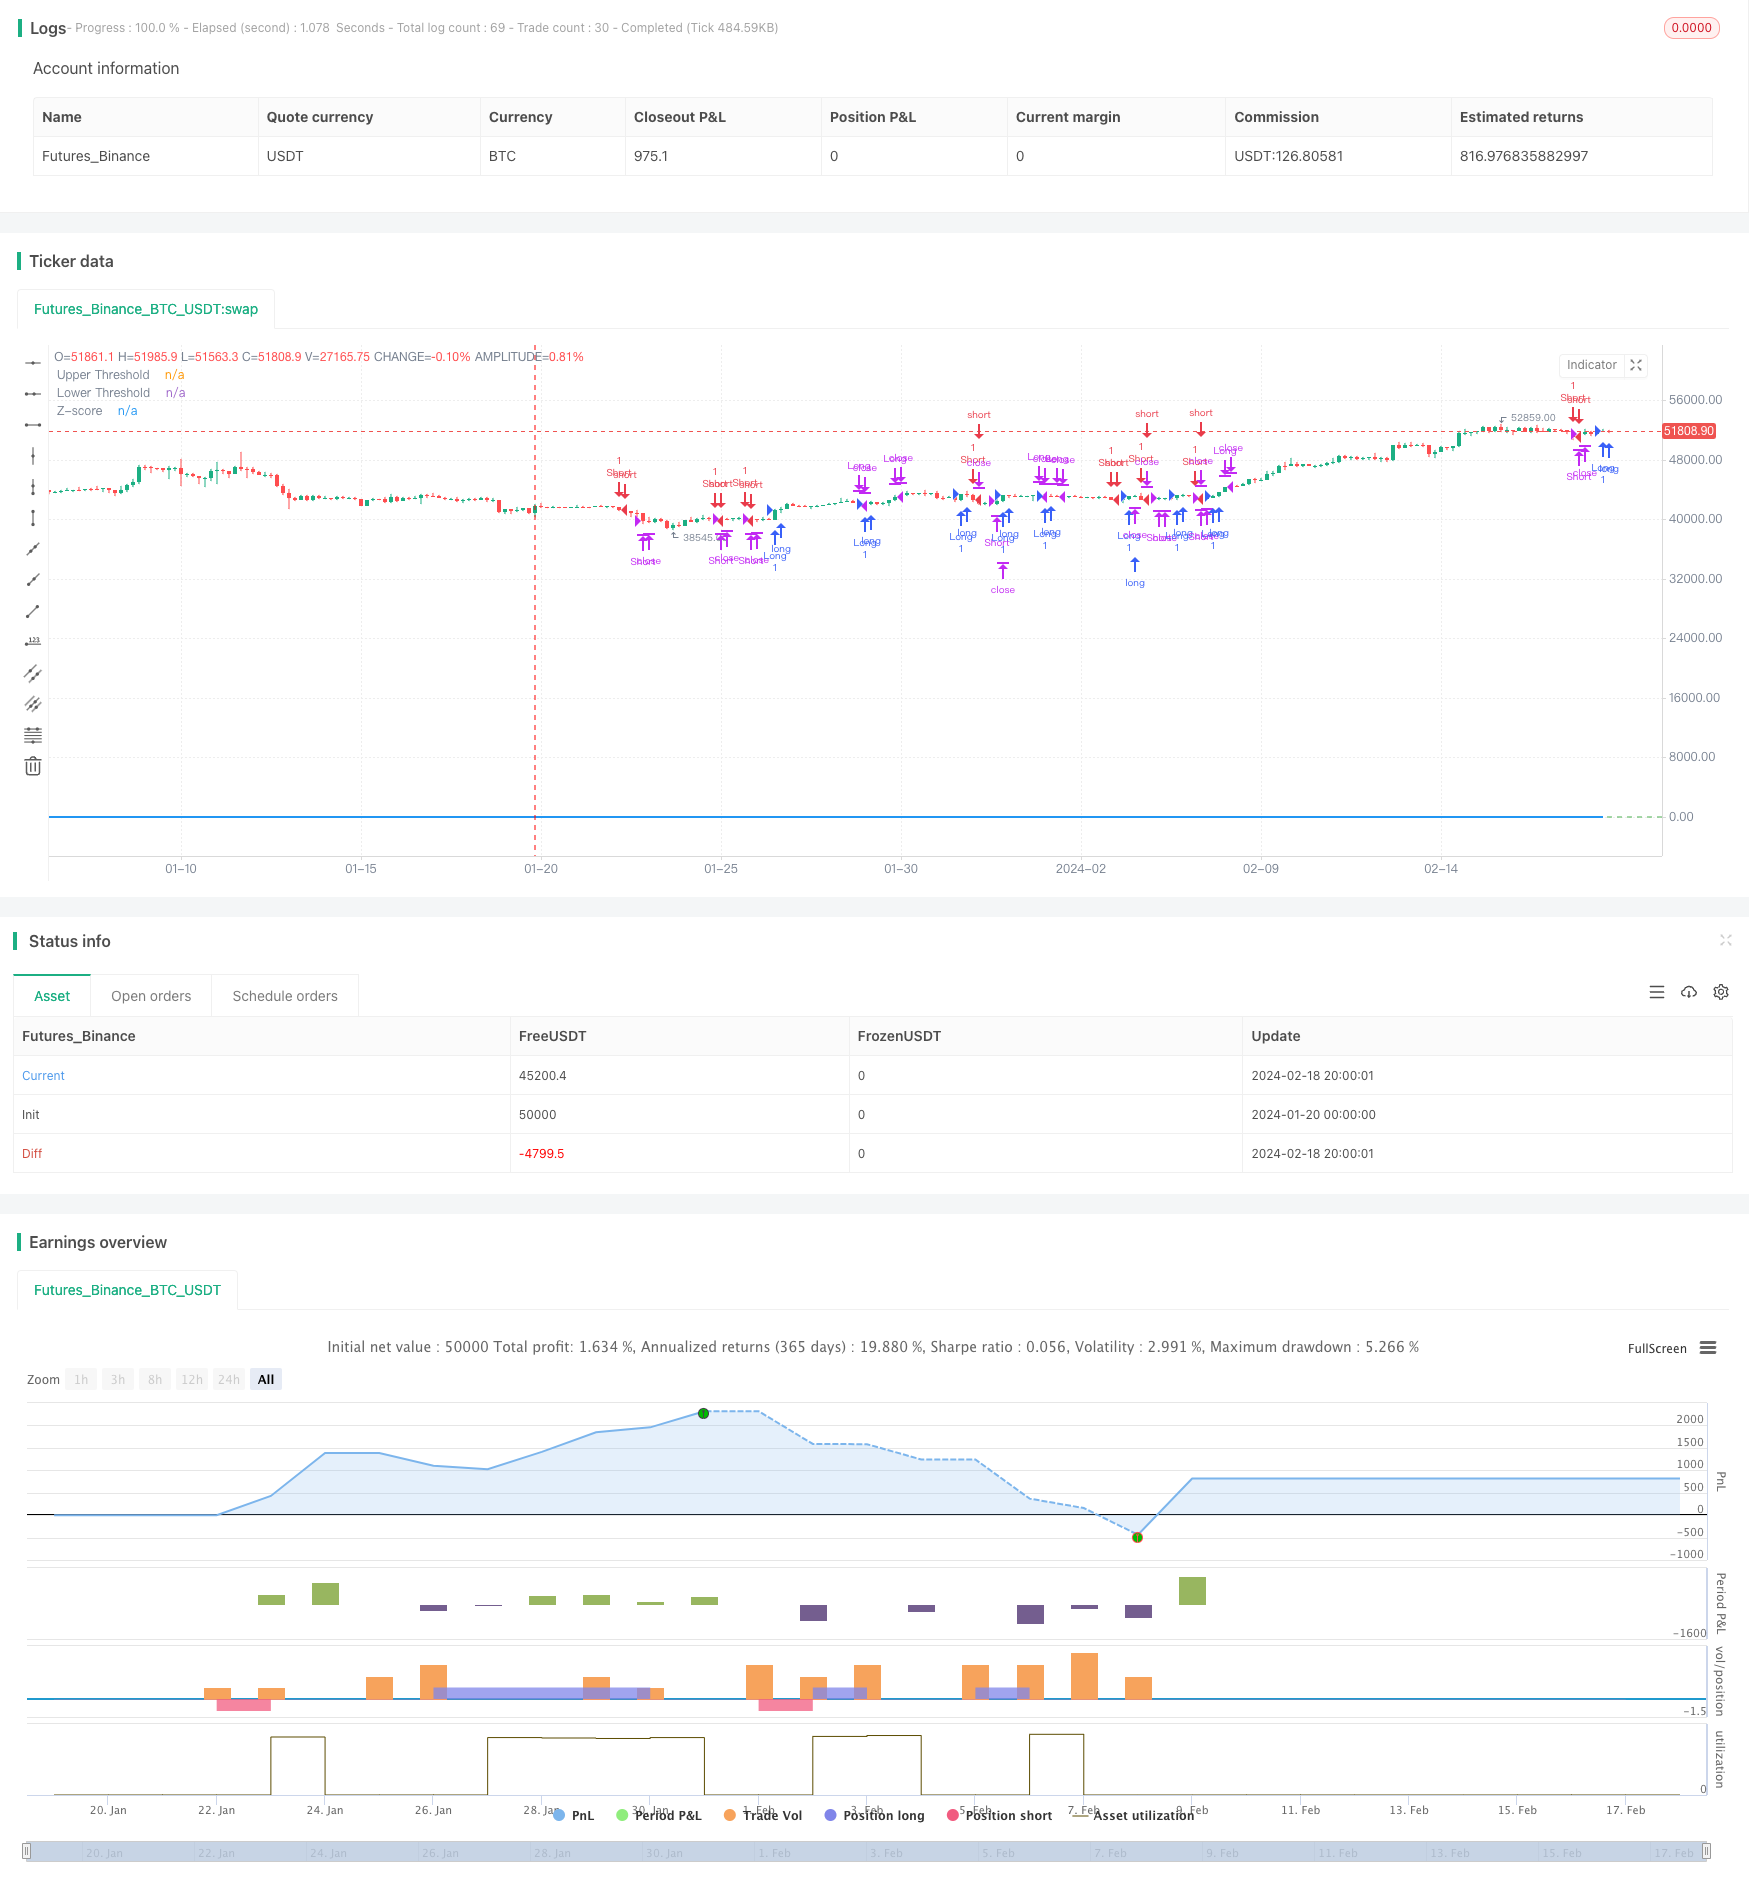
start: 2024-01-20 00:00:00
end: 2024-02-19 00:00:00
period: 4h
basePeriod: 15m
exchanges: [{"eid":"Futures_Binance","currency":"BTC_USDT"}]
*/
//@version=5
strategy("GC Momentum Strategy with Stoploss and Limits", overlay=true)
// Input for the length of the EMA
ema_length = input.int(21, title="EMA Length", minval=1)
// Exponential function parameters
steepness = 2
// Calculate the EMA
ema = ta.ema(close, ema_length)
// Calculate the deviation of the close price from the EMA
deviation = close - ema
// Calculate the standard deviation of the deviation
std_dev = ta.stdev(deviation, ema_length)
// Calculate the Z-score
z_score = deviation / std_dev
// Long entry condition if Z-score crosses +0.5 and is below 3 standard deviations
long_condition = ta.crossover(z_score, 0.5)
// Short entry condition if Z-score crosses -0.5 and is above -3 standard deviations
short_condition = ta.crossunder(z_score, -0.5)
// Exit long position if Z-score converges below 0.5 from top
exit_long_condition = ta.crossunder(z_score, 0.5)
// Exit short position if Z-score converges above -0.5 from below
exit_short_condition = ta.crossover(z_score, -0.5)
// Stop loss condition if Z-score crosses above 3 or below -3
stop_loss_long = ta.crossover(z_score, 3)
stop_loss_short = ta.crossunder(z_score, -3)
// Enter and exit positions based on conditions
if (long_condition)
strategy.entry("Long", strategy.long)
if (short_condition)
strategy.entry("Short", strategy.short)
if (exit_long_condition)
strategy.close("Long")
if (exit_short_condition)
strategy.close("Short")
if (stop_loss_long)
strategy.close("Long")
if (stop_loss_short)
strategy.close("Short")
// Plot the Z-score on the chart
plot(z_score, title="Z-score", color=color.blue, linewidth=2)
// Optional: Plot zero lines for reference
hline(0.5, "Upper Threshold", color=color.red)
hline(-0.5, "Lower Threshold", color=color.green)