概述
该策略是一目均衡指标和移势叠加指标的组合,用于发现股票价格的潜在趋势,判断买入和卖出的时机。该策略通过计算一目均衡线,结合移势叠加指标判断趋势方向和发出交易信号,同时利用RSI指标进行过滤来控制交易风险。
策略原理
该策略主要由三部分组成:
一目均衡指标:一目均衡指标主要使用转向点(Tenkan-Sen)、基准点(Kijun-sen)两条线构成,形成“一目均衡”的形态。转向点线代表价格的短期趋势,基准点线代表价格的中期趋势。转向点线与基准点线的交叉构成买入和卖出信号。
移势叠加指标:移势叠加指标通过计算离散相对值区间带和平滑相对值来判断趋势的方向。当价格从外侧区域带进入中间区域带时产生交易信号。
RSI指标:RSI指标用于判断价格是否过冲或超卖,设置超买线和超卖区间,结合移势叠加指标的交易信号一起判断发出买入和卖出信号。
具体来说,该策略会监控转向点线和基准点线是否发生金叉(转向点线上穿基准点线)和死叉(转向点线下穿基准点线)以判断买入卖出时机。同时结合移势叠加指标判断整体趋势方向。当两种指标同时发出信号时,若RSI指标显示没有超买超卖的情况,则发出交易信号。
策略优势
这种策略结合运用不同指标判断趋势方向和交易时机,可以提高判断准确率,利用指标之间的互补优势,避免单一指标判断失误的概率。具体优势如下:
使用转向点线与基准点线构成一目均衡指标,可以同时反映短期趋势和中期趋势,判断准确性较单一MA指标高。
移势叠加指标判断整体趋势方向准确可靠,与一目均衡指标形成互补。
RSI指标设置过滤条件,可以有效过滤假突破,避免交易风险。
该策略容易理解与实现,适用于量化交易。
策略风险
尽管该策略使用多种指标进行配合判断,可以一定程度上减少误判的可能,但仍存在以下主要风险:
参数设置风险。转向点线、基准点线等指标参数设置不当,将导致交易信号错误。需要优化参数以适应不同品种。
趋势反转风险。在盘整行情中,可能会产生虚假信号。需要结合更多指标判断趋势反转信号。
RSI过滤条件太严格的风险。可能滤掉较多交易机会。可以适当放宽RSI的参数。
对应解决方法:
使用更多历史数据针对不同品种进行参数优化,确保参数设置合理。
在策略中加入止损机制。当价格向相反方向突破止损线时退出仓位。
优化RSI的参数,适当放宽过滤条件,在保证风险控制的前提下,获取更多交易机会。
策略优化方向
该策略还存在可以继续优化的方向:
增加机器学习算法,使策略参数随市场变化进行动态调整,提高策略适应性。
将策略组件打包成为模块,进行模块化管理,便于快速替换其中的组件或单独测试优化组件,提高开发效率。
增加数据集成模块,从更多数据源获取市场数据,组成高质量训练集,提升机器学习效果。
开发回测工具对策略全面回测,记录各种评价指标,辅助参数优化调整与模型选择。
使用云计算平台部署策略系统,利用弹性计算资源快速并行回测,加速参数调优迭代,降低策略开发成本。
总结
该策略运用一目均衡指标和移势叠加指标两个指标进行配合,互补判断价格趋势和交易时机。同时利用RSI指标进行过滤,控制交易风险。这种多指标组合策略形式可以提高判断准确率,获得更好的策略效果。但是策略中参数设置与指标选择仍需要针对不同品种不断测试与优化,才能使策略参数调整和指标选择仍需要针对不同产品进行持续的测试和优化,以便策略能够快速适应市场变化并具有持久的盈利能力。
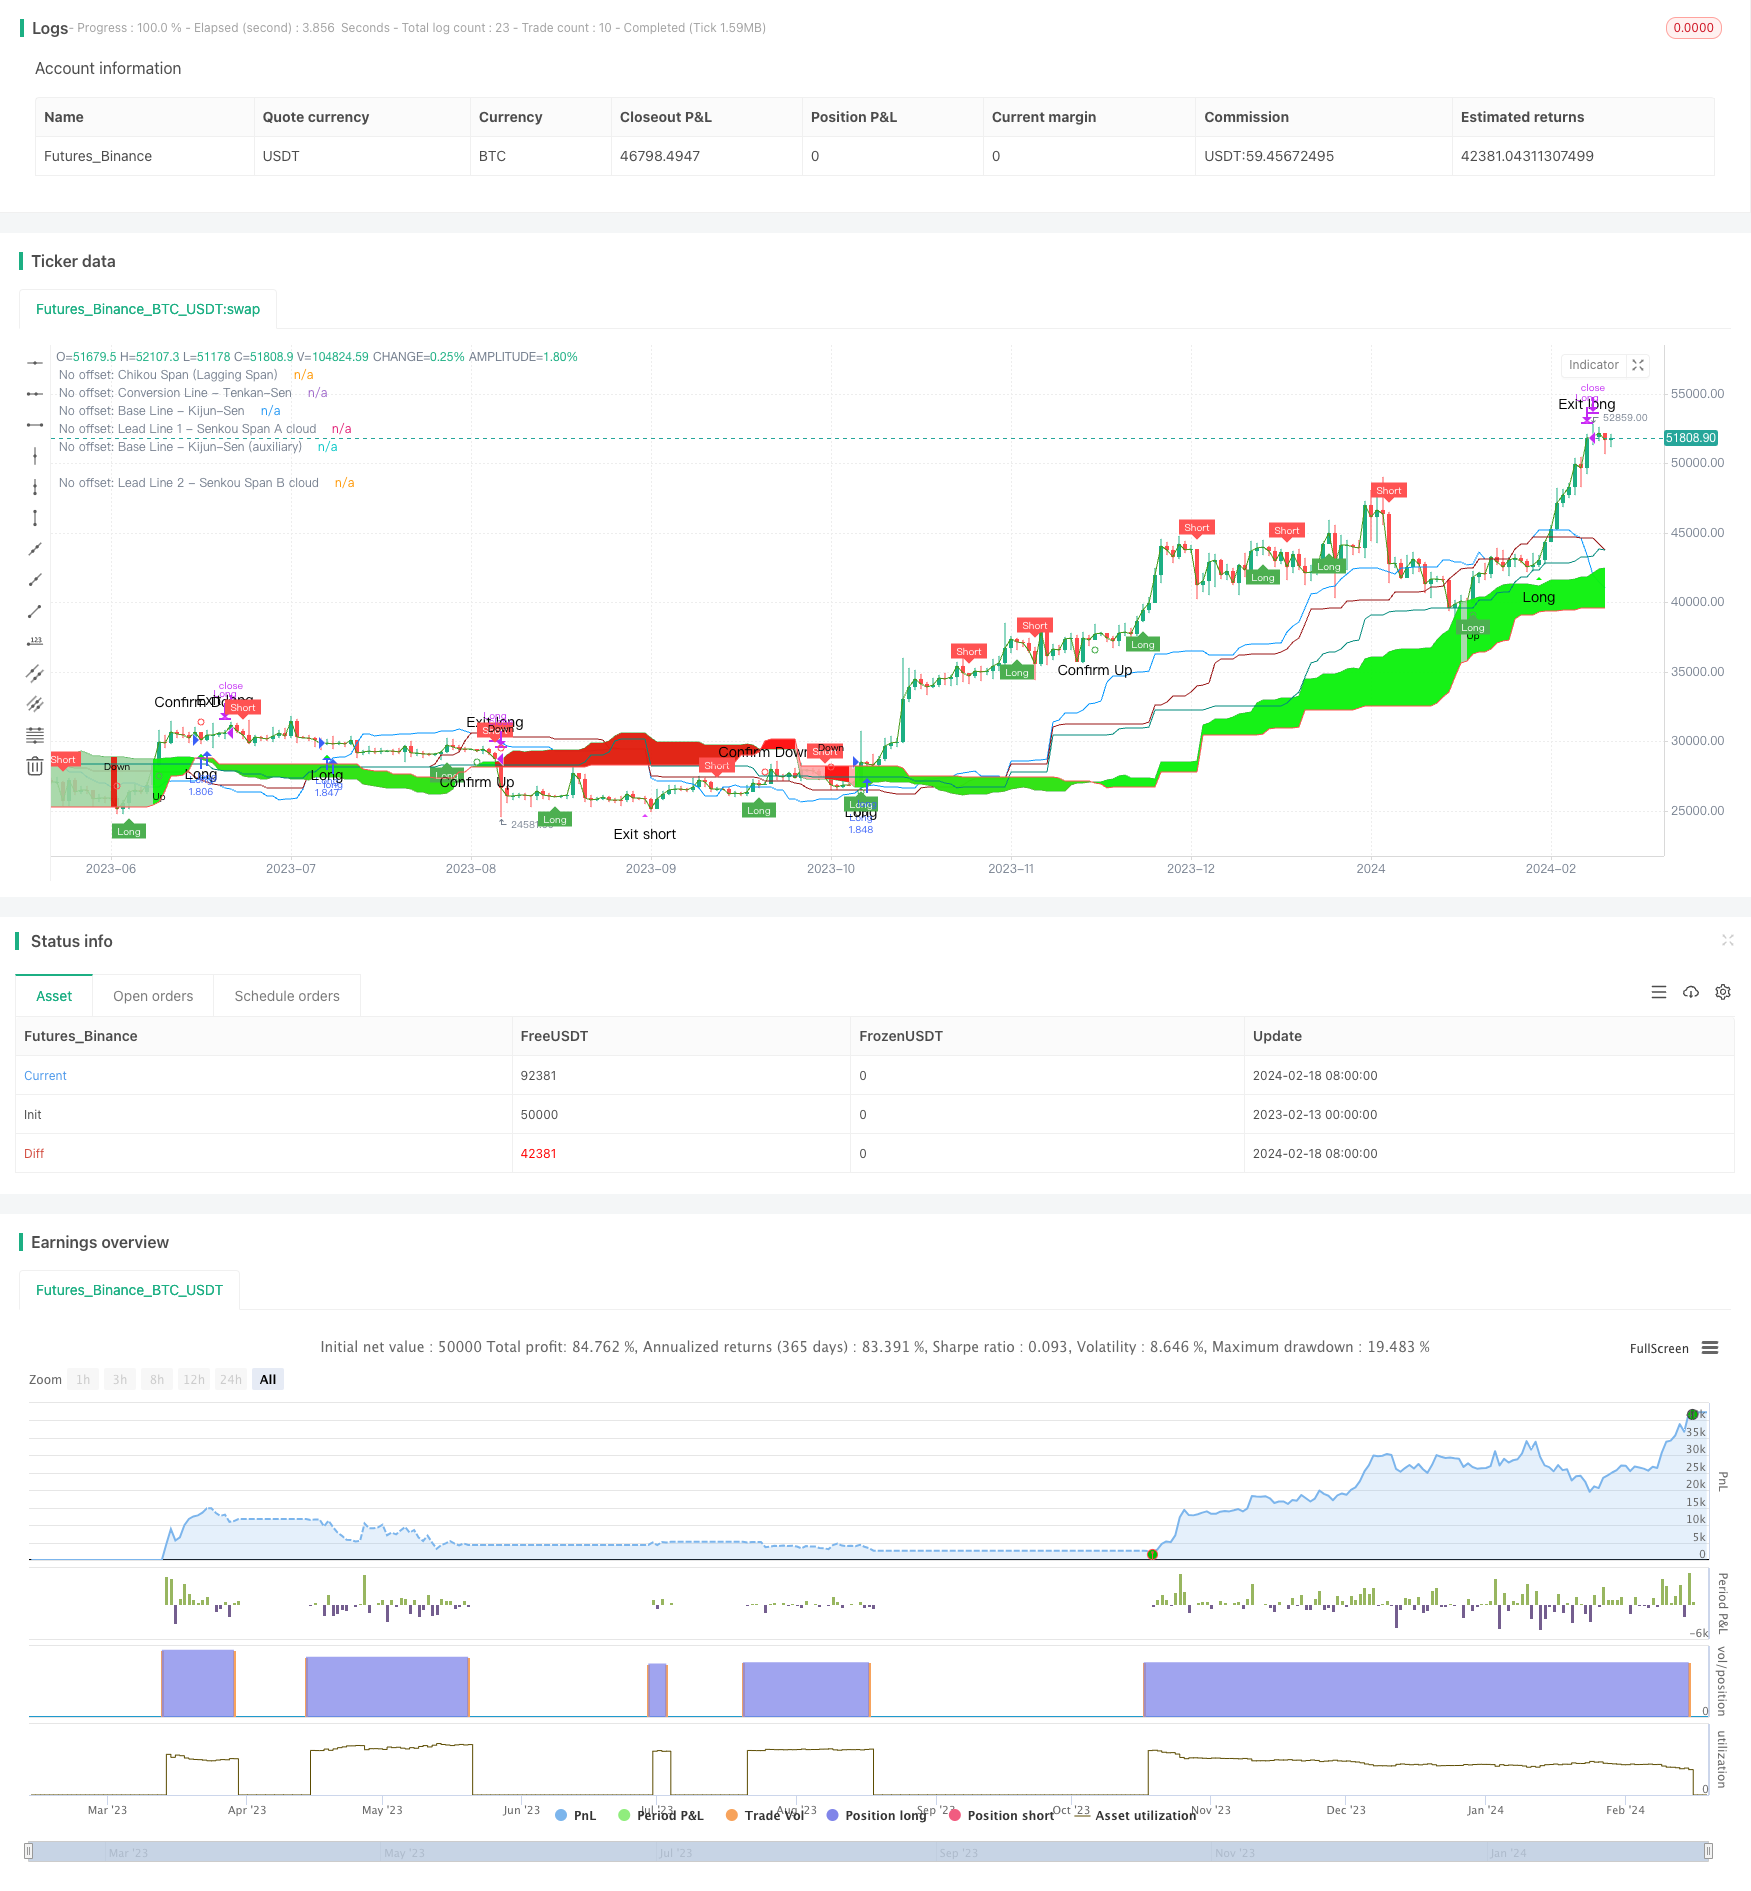
/*backtest
start: 2023-02-13 00:00:00
end: 2024-02-19 00:00:00
period: 1d
basePeriod: 1h
exchanges: [{"eid":"Futures_Binance","currency":"BTC_USDT"}]
*/

// This source code is subject to the terms of the Mozilla Public License 2.0 at https://mozilla.org/MPL/2.0/
// © KryptoNight

//@version=4
// comment/uncomment Study/Strategy to easily switch modes
// study("Ichimoku Kinko Hyo Cloud - no offset - no repaint - RSI filter - alerts", shorttitle="IchiCloud + RSI - alerts", overlay=true)
// ============================================================================== Strategy mode - uncomment to activate
strategy("Ichimoku Kinko Hyo Cloud - no offset - no repaint - RSI filter - strategy", shorttitle="IchiCloud + RSI - Strategy Tester Mode", overlay=true, pyramiding = 0,
  currency = currency.EUR, initial_capital = 2000, default_qty_type = strategy.percent_of_equity, default_qty_value = 100,
  calc_on_every_tick = true, calc_on_order_fills = true, commission_type = strategy.commission.percent, commission_value = 0.15)
// ==============================================================================

// ------------------------------------------------------------------------------

ichiCloud_offset   = input(false, title="Standard Ichimoku Cloud")                  // with the visual offset
ichiCloud_noOffset = input(true,  title="Ichimoku Cloud - no offset - no repaint")  // without the visual offset

conversion_prd = input(9, minval=1, title="Conversion Line Period - Tenkan-Sen")
baseline_prd   = input(27, minval=1, title="Base Line Period - Kijun-Sen")
baselineA_prd  = input(52, minval=1, title="Base Line Period - Kijun-Sen (auxiliary)")
leadingSpan_2prd = input(52, minval=1, title="Lagging Span 2 Periods - Senkou Span B")
displacement = input(26, minval=0, title="Displacement: (-) Chikou Span; (+) Senkou Span A")
extra_bars = input(1, minval=0, title="Displacement: additional bars")
laggingSpan_src = input(close, title="Lagging Span price source - Chikou-Span")

donchian(len) => avg(lowest(len), highest(len))
displ = displacement-extra_bars
// ------------------------------------------------------------------------------
// OFFSET:
conversion = donchian(conversion_prd)   // Conversion Line - Tenkan-Sen (9 Period)
baseline  = donchian(baseline_prd)      // Base Line - Kijun-Sen (26 Period)
baselineA = donchian(baselineA_prd)     // Base Line Period - Kijun-Sen (auxiliary)
leadingSpanA = avg(conversion, baseline)
leadingSpanB = donchian(leadingSpan_2prd)
laggingSpan = laggingSpan_src

// Color - bullish, bearish
col_cloud = leadingSpanA>=leadingSpanB ? color.green : color.red

// Cloud Lines
spanA = plot(ichiCloud_offset? leadingSpanA : na, offset=displ, title="Offset: Lead Line 1 - Senkou Span A cloud", color=color.green)
spanB = plot(ichiCloud_offset? leadingSpanB : na, offset=displ, title="Offset: Lead Line 2 - Senkou Span B cloud", color=color.red)
fill(spanA, spanB, color=col_cloud, transp=80, title="Offset: Ichimoku Cloud - Leading Span 1 & 2 based coloring")

// Other Lines
conversion_p = plot(ichiCloud_offset? conversion : na, title="Offset: Conversion Line - Tenkan-Sen", color=#0496ff)
standard_p = plot(ichiCloud_offset? baseline : na, title="Offset: Base Line - Kijun-Sen", color=#991515)
standardA_p = plot(ichiCloud_offset? baselineA : na, title="Offset: Base Line - Kijun-Sen (auxiliary)", color=color.teal)
lagging_Span_p = plot(ichiCloud_offset? laggingSpan : na, offset=-displ, title="Offset: Chikou Span (Lagging Span)", color=#459915)

// ------------------------------------------------------------------------------
// NO OFFSET:
conversion_noOffset = conversion[displ] // Conversion Line - Tenkan-Sen (9 Period)
baseline_noOffset  = baseline[displ]    // Base Line - Kijun-Sen (26 Period)
baselineA_noOffset = baselineA[displ]   // Base Line Period - Kijun-Sen (auxiliary)
leadingSpanA_noOffset = leadingSpanA[displ*2]
leadingSpanB_noOffset = leadingSpanB[displ*2]
laggingSpan_noOffset = laggingSpan[0]

// Color - bullish, bearish
col_cloud_noOffset = leadingSpanA_noOffset>=leadingSpanB_noOffset ? color.green : color.red

// Cloud Lines
spanA_noOffset = plot(ichiCloud_noOffset? leadingSpanA_noOffset : na, title="No offset: Lead Line 1 - Senkou Span A cloud", color=color.green, transp=0)
spanB_noOffset = plot(ichiCloud_noOffset? leadingSpanB_noOffset : na, title="No offset: Lead Line 2 - Senkou Span B cloud", color=color.red, transp=0)
fill(spanA_noOffset, spanB_noOffset, color=col_cloud_noOffset, transp=80, title="No offset: Ichimoku Cloud - Leading Span 1 & 2 based coloring")

// Other Lines
conversion_p_noOffset = plot(ichiCloud_noOffset? conversion_noOffset : na, title="No offset: Conversion Line - Tenkan-Sen", color=#0496ff, transp=0)
baseline_p_noOffset = plot(ichiCloud_noOffset? baseline_noOffset : na, title="No offset: Base Line - Kijun-Sen", color=#991515, transp=0)
baselineA_p_noOffset = plot(ichiCloud_noOffset? baselineA_noOffset : na, title="No offset: Base Line - Kijun-Sen (auxiliary)", color=color.teal, transp=0)
laggingSpan_p_noOffset = plot(ichiCloud_noOffset? laggingSpan_noOffset : na, title="No offset: Chikou Span (Lagging Span)", color=#459915, transp=0)

// ==============================================================================
// Conditions & Alerts (based on the lines without offset)

maxC = max(leadingSpanA_noOffset,leadingSpanB_noOffset)
minC = min(leadingSpanA_noOffset,leadingSpanB_noOffset)

// Trend start signals: crosses between Chikou Span (Lagging Span) and the Cloud (Senkou Span A, Senkou Span B)
uptrend_start   = crossover(laggingSpan_noOffset,maxC)
downtrend_start = crossunder(laggingSpan_noOffset,minC)

// Trends
uptrend   = laggingSpan_noOffset>maxC // Above Cloud
downtrend = laggingSpan_noOffset<minC // Below Cloud

// No trend: choppy trading - the price is in transition
notrend = maxC>=laggingSpan_noOffset and laggingSpan_noOffset>=minC

// Confirmations
uptrend_confirm   = crossover(leadingSpanA_noOffset,leadingSpanB_noOffset)
downtrend_confirm = crossunder(leadingSpanA_noOffset,leadingSpanB_noOffset)

// Signals - crosses between Conversion Line (Tenkan-Sen) and Base Line (Kijun-Sen)
bullish_signal = crossover(conversion_noOffset,baseline_noOffset)
bearish_signal = crossunder(conversion_noOffset,baseline_noOffset)

// Various alerts
alertcondition(uptrend_start,   title="Uptrend Started",   message="Uptrend Started")
alertcondition(downtrend_start, title="Downtrend Started", message="Downtrend Started")

alertcondition(uptrend_confirm,   title="Uptrend Confirmed",   message="Uptrend Confirmed")
alertcondition(downtrend_confirm, title="Downtrend Confirmed", message="Downtrend Confirmed")

alertcondition(bullish_signal, title="Buy Signal",  message="Buy Signal")
alertcondition(bearish_signal, title="Sell Signal", message="Sell Signal")

rsi_OBlevel = input(50, title="RSI Filter: Overbought level (0 = off)")
rsi_OSlevel = input(100,title="RSI Filter: Oversold level (100 = off)")
rsi_len = input(14,title="RSI Length")
rsi_src = input(close,title="RSI Price source")
rsi = rsi(rsi_src,rsi_len)

// Strategy -------------------------------
long_signal  = bullish_signal and uptrend   and rsi<=rsi_OSlevel // breakout filtered by the rsi
exit_long    = bearish_signal and uptrend
short_signal = bearish_signal and downtrend and rsi>=rsi_OBlevel // breakout filtered by the rsi
exit_short   = bullish_signal and downtrend

// Strategy alerts
alertcondition(long_signal, title="Long Signal - Uptrend",      message="Long Signal - Uptrend")
alertcondition(exit_long,   title="Long Exit Signal - Uptrend", message="Long Exit Signal - Uptrend")

alertcondition(short_signal, title="Long Signal - Downtrend",       message="Long Signal - Downtrend")
alertcondition(exit_short,   title="Short Exit Signal - Downtrend", message="Short Exit Signal - Downtrend")

// Plot areas for trend and transition
color_trend = uptrend? #00FF00 : downtrend? #FF0000 : notrend? color.new(#FFFFFF, 50) : na
fill(spanA_noOffset, spanB_noOffset, color=color_trend, transp=90, title="No offset: Ichimoku Cloud - Lagging Span & Cloud based coloring")

plotshape(ichiCloud_noOffset?uptrend_start:na, title="No offset: Uptrend Started", color=color.green, style=shape.circle, location=location.belowbar, size=size.tiny, text="Up")
plotshape(ichiCloud_noOffset?downtrend_start:na, title="No offset: Downtrend Started", color=color.red, style=shape.circle,location=location.abovebar, size=size.tiny, text="Down")

plotshape(ichiCloud_noOffset?uptrend_confirm:na, title="No offset: Uptrend Confirmed", color=color.green, style=shape.circle, location=location.belowbar, size=size.small, text="Confirm Up")
plotshape(ichiCloud_noOffset?downtrend_confirm:na, title="No offset: Downtrend Confirmed", color=color.red, style=shape.circle, location=location.abovebar, size=size.small, text="Confirm Down")

plotshape(ichiCloud_noOffset?long_signal:na, title="No offset: Long Signal", color=#00FF00, style=shape.triangleup, location=location.belowbar, size=size.small, text="Long")
plotshape(ichiCloud_noOffset?exit_long:na, title="No offset: Exit Long Signal", color=color.fuchsia, style=shape.triangledown, location=location.abovebar, size=size.small, text="Exit long")

plotshape(ichiCloud_noOffset?short_signal:na, title="No offset: Short Signal", color=#FF0000, style=shape.triangledown, location=location.abovebar, size=size.small, text="Short")
plotshape(ichiCloud_noOffset?exit_short:na, title="No offset: Exit Short Signal", color=color.fuchsia, style=shape.triangleup, location=location.belowbar, size=size.small, text="Exit short")

// ============================================================================== Strategy Component - uncomment to activate
if (long_signal)
    strategy.entry("Long",strategy.long)
if (exit_long)
    strategy.close("Long")
// if (short_signal)
//    strategy.entry("Short",strategy.short)
// if (exit_short)
//    strategy.close("Short")
// ==============================================================================


//@version=4
// This source code is subject to the terms of the Mozilla Public License 2.0 at https://mozilla.org/MPL/2.0/
// © colinmck


RSI_Period = input(10, title='RSI Length')
SF = input(5, title='RSI Smoothing')
QQE = input(2.438, title='Fast QQE Factor')
ThreshHold = input(10, title="Thresh-hold")

src = close
Wilders_Period = RSI_Period * 3 - 1

Rsi = rsi(src, RSI_Period)
RsiMa = ema(Rsi, SF)
AtrRsi = abs(RsiMa[1] - RsiMa)
MaAtrRsi = ema(AtrRsi, Wilders_Period)
dar = ema(MaAtrRsi, Wilders_Period) * QQE

longband = 0.0
shortband = 0.0
trend = 0

DeltaFastAtrRsi = dar
RSIndex = RsiMa
newshortband = RSIndex + DeltaFastAtrRsi
newlongband = RSIndex - DeltaFastAtrRsi
longband := RSIndex[1] > longband[1] and RSIndex > longband[1] ? max(longband[1], newlongband) : newlongband
shortband := RSIndex[1] < shortband[1] and RSIndex < shortband[1] ? min(shortband[1], newshortband) : newshortband
cross_1 = cross(longband[1], RSIndex)
trend := cross(RSIndex, shortband[1]) ? 1 : cross_1 ? -1 : nz(trend[1], 1)
FastAtrRsiTL = trend == 1 ? longband : shortband

// Find all the QQE Crosses

QQExlong = 0
QQExlong := nz(QQExlong[1])
QQExshort = 0
QQExshort := nz(QQExshort[1])
QQExlong := FastAtrRsiTL < RSIndex ? QQExlong + 1 : 0
QQExshort := FastAtrRsiTL > RSIndex ? QQExshort + 1 : 0

//Conditions

qqeLong = QQExlong == 1 ? FastAtrRsiTL[1] - 50 : na
qqeShort = QQExshort == 1 ? FastAtrRsiTL[1] - 50 : na

// Plotting

plotshape(qqeLong, title="QQE long", text="Long", textcolor=color.white, style=shape.labelup, location=location.belowbar, color=color.green, transp=0, size=size.tiny)
plotshape(qqeShort, title="QQE short", text="Short", textcolor=color.white, style=shape.labeldown, location=location.abovebar, color=color.red, transp=0, size=size.tiny)

// Alerts

alertcondition(qqeLong, title="Long", message="Long")
alertcondition(qqeShort, title="Short", message="Short")