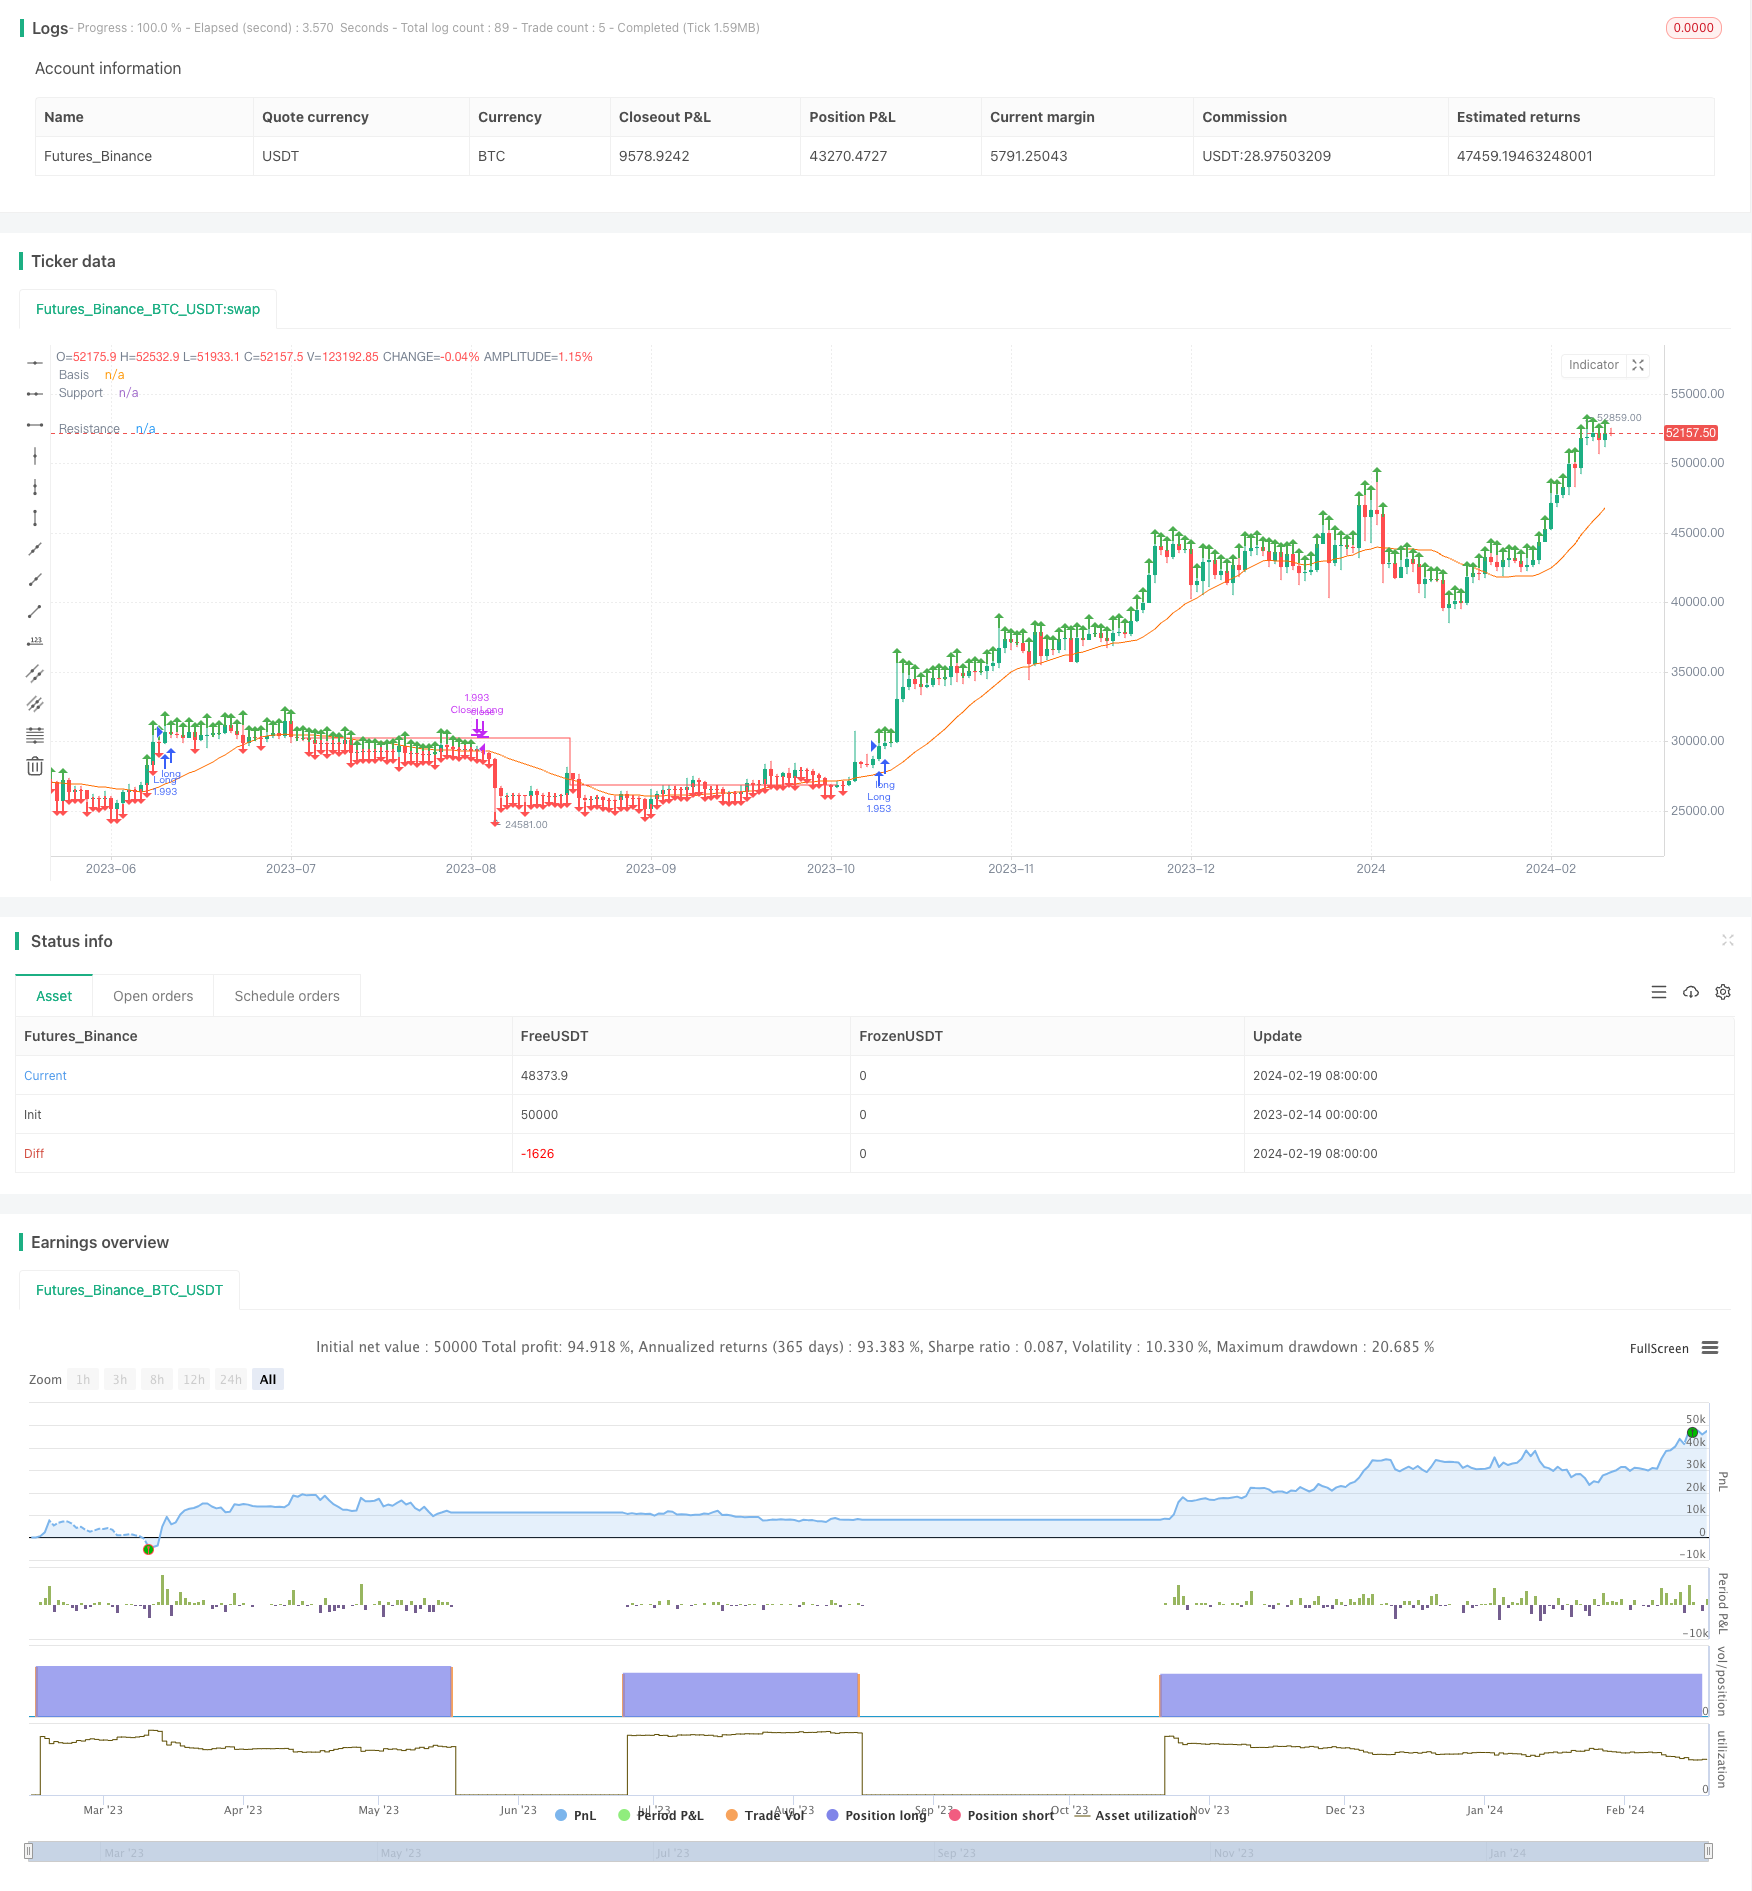
概述
该策略是一个基于简单移动平均线确定趋势方向,配合阻力支撑线形成突破信号的长线持仓策略。通过计算价格Pivot高点和Pivot低点,绘制阻力线和支撑线,当价格突破阻力线时做多,突破支撑线时平仓。该策略适合趋势明显的股票,可以获得较好的风险回报比。
策略原理
- 计算20日简单移动平均线作为判断趋势的基准线
- 根据用户输入参数计算Pivot高点和Pivot低点
- 根据Pivot高点和Pivot低点绘制阻力线和支撑线
- 当收盘价高于阻力线时,做多入场
- 当支撑线下穿阻力线时,平仓
该策略使用简单移动平均线判断总体趋势方向,再利用关键点突破形成交易信号,属于典型的突破型策略。通过关键点和趋势判断,可以有效过滤假突破。
优势分析
- 策略机会充足,适合高波动的股票,容易捕捉趋势
- 风险控制 to 做,风险收益比高
- 利用突破信号,避免假突破风险
- 可自定义参数,适应性强
风险分析
- 依赖参数优化,参数不当会增加假突破概率
- 突破信号延迟,可能错过部分机会
- 震荡行情中容易止损
- 支持线调整不及时可能带来亏损
可以通过实盘优化参数,结合止损止盈策略来降低风险。
优化方向
- 优化移动平均线周期参数
- 优化支撑阻力线参数
- 增加止损止盈策略
- 增加突破确认机制
- 结合交易量等指标过滤信号
总结
该策略整体是一个典型的突破型策略,依赖参数优化和流动性,适合追踪趋势的交易者。作为一个参考框架,可根据实际需要进行模块扩展,通过止损止盈、信号过滤等机制来降低风险,提高稳定性。
策略源码
/*backtest
start: 2023-02-14 00:00:00
end: 2024-02-20 00:00:00
period: 1d
basePeriod: 1h
exchanges: [{"eid":"Futures_Binance","currency":"BTC_USDT"}]
*/

// This source code is subject to the terms of the Mozilla Public License 2.0 at https://mozilla.org/MPL/2.0/
// © CheatCode1

//@version=5
strategy("Quantitative Trend Strategy- Uptrend long", 'Steady Uptrend Strategy', overlay=true, initial_capital = 1500, default_qty_value = 100, commission_type = strategy.commission.percent, commission_value = 0.01, default_qty_type = strategy.percent_of_equity)


length = input.int(20, minval=1)
src = input(close, title="Source")
basis = ta.sma(src, length)
offset = input.int(0, "Offset", minval = -500, maxval = 500)
plot(basis, "Basis", color=#FF6D00, offset = offset)

inp1 = input.int(46, 'LookbackLeft')
inp2 = input.int(32, 'LookbackRight')

l1 = ta.pivothigh(close, inp1, inp2)
S1 = ta.pivotlow(close, inp1, inp2)

// plot(l1, 'Pivothigh', color.red, 1)
// // plot(S1, 'Pivot Low', color.red)

l1V = ta.valuewhen(l1, close, 0)
S1V = ta.valuewhen(S1, close, 0)

Plotl1 = not na(l1) ? l1V : na
PlotS1 = not na(S1) ? S1V : na

plot(Plotl1, 'Resistance', color.green, 1, plot.style_stepline, true)
plot(PlotS1, 'Support', color.red, 1, plot.style_stepline, true)

Priceforlong = close > l1V ? true : na
Priceforshort = close < S1V ? true : na

plotshape(Priceforlong ? high : na, 'p', shape.arrowup, location.abovebar, color.green, size = size.small)
plotshape(Priceforshort ? low : na, 's', shape.arrowdown, location.belowbar, color.red, size = size.small)

vol = volume
volma = ta.sma(vol, 20)

Plotl1C = ta.valuewhen(na(Plotl1), l1V, 0)
PlotS1C = ta.valuewhen(na(PlotS1), S1V, 0)
//Strategy Execution
volc = volume > volma

Lc1 = Priceforlong

Sc1 = Priceforshort

sL = Plotl1 < PlotS1 ? close : na
sS = PlotS1 > Plotl1 ? close : na


if Lc1
    strategy.entry('Long', strategy.long)
// if Sc1 and C2
//     strategy.entry('Short', strategy.short)

if Priceforshort
    strategy.cancel('Long')
if Priceforlong
    strategy.cancel('Short')


// Stp1 = ta.crossover(k, d)
// Ltp1 = ta.crossunder(k, d)
// Ltp = d > 70  ? Ltp1 : na
// Stp = d < 30  ? Stp1 : na


if strategy.openprofit >= 0 and sL
    strategy.close('Long')
if strategy.openprofit >= 0 and sS
    strategy.close('Short')
takeP = input.float(2, title='Take Profit') / 100
stopL = input.float(1.75, title='Stop Loss') / 100


// // Pre Directionality

Stop_L = strategy.position_avg_price * (1 - stopL)

Stop_S = strategy.position_avg_price * (1 + stopL)

Take_S= strategy.position_avg_price * (1 - takeP)

Take_L = strategy.position_avg_price * (1 + takeP)

// sL = Plotl1 < PlotS1 ? close : na
// sS = PlotS1 < Plotl1 ? close : na

// //Post Excecution
if strategy.position_size > 0 and not (Lc1)
    strategy.exit("Close Long", stop = Stop_L, limit = Take_L)

if strategy.position_size < 0 and not (Sc1)
    strategy.exit("Close Short", stop = Stop_S, limit = Take_S)