概述
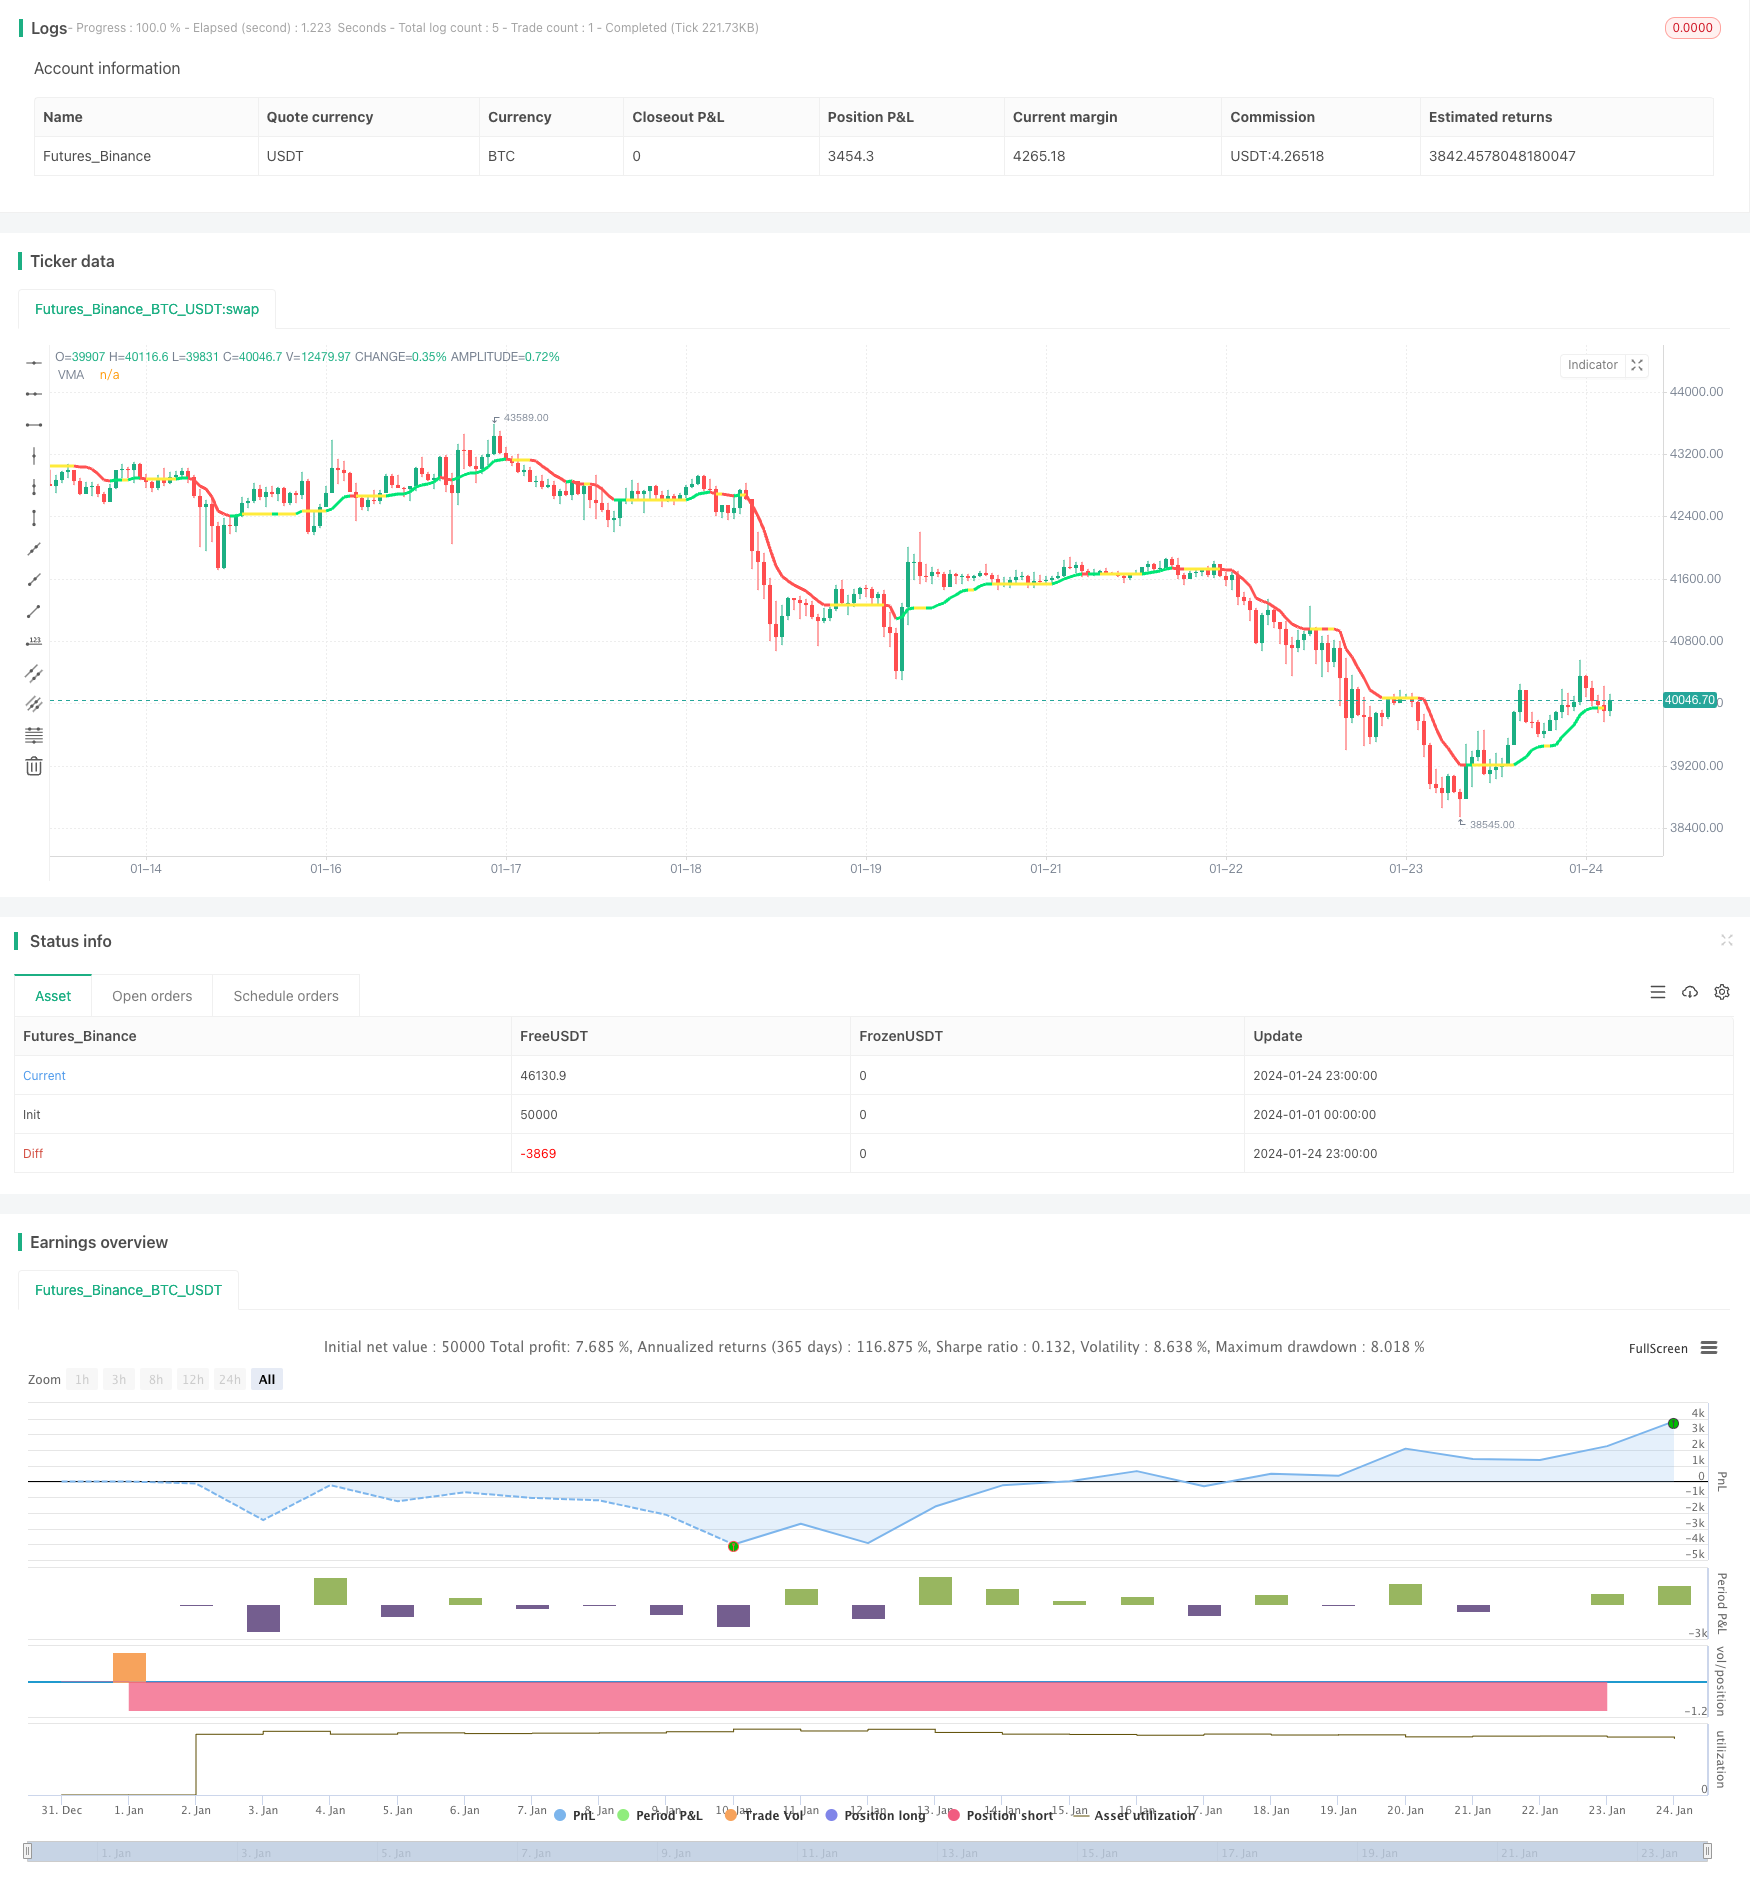
TradingVMA策略是一个基于可变移动平均线的量化交易策略。该策略运用变化的移动平均线来捕捉市场趋势,并据此产生交易信号。
策略原理
TradingVMA策略的核心是计算可变长度的移动平均线(Variable Moving Average,VMA)。移动平均线是一种广为人知的技术指标,它计算一定周期内的平均价格。TradingVMA策略所使用的VMA具有变化的周期长度。
具体来说,该策略首先计算一系列中间量,如价格方向运动指标(PDM,MDIM)、平滑处理后的数据(PDMs,MDMs)。这些数据最终被用来得到指标强度(iS)。该指标反映了价格波动的力度。
然后,TradingVMA策略根据指标强度,动态调整移动平均线的长度。当市场波动加大时,移动平均线的周期会变短,反之周期会加长。这样可以更快地响应市场变化。
最后,策略比较当前价格与VMA的大小,产生交易信号。价格高于VMA时做多,价格低于VMA时做空。
优势分析
TradingVMA策略具有以下主要优势:
可变周期 Filters Noise 更稳定 - 可变移动平均线周期随市场变化调整,可以滤波噪音,获取更稳定的趋势信号。
快速响应价格变化 Improves Responsiveness - 可变移动平均线可以快速响应价格变化,捕捉新趋势的转折点。
减少交易频率 Reduce Overtrading - 相比固定周期指标,TradingVMA可以减少不必要的交易次数。
可自定义参数 Flexible Parameters - 该策略允许用户根据自己的偏好选择参数,适应不同市场环境。
风险分析
TradingVMA策略也存在以下主要风险:
可错过快速反转 Miss Rapid Reversals - 当趋势快速反转时,持续调整的移动平均线可能会延迟做出反应。
受跟随偏差影响 Lagging Bias - 所有移动平均线策略或多或空都会有一定程度的跟随偏差。
多空号错误 Wrong Signals - 在横盘整理的市场中,TradingVMA可能会产生错误的多空信号。
参数优化难度 Parameter Optimization Difficulty - 找到最佳参数组合可能会比较困难。
可以通过止损,调整参数组合等方式来控制这些风险。
优化方向
TradingVMA策略还可以从以下几个方向进行优化:
整合其他指标 Combine Other Indicators - 与其它趋势、趋势反转等指标组合使用可以提高信号质量。
最优参数寻优 Parameter Optimization - 通过历史回测和参数优化找到最佳参数组合。
自适应交易规则 Adaptive Trading Rules - 根据不同市场环境采取不同的开仓规则、止损规则等。
算法交易系统化 Systemization - 将策略算法化和系统化,便于回测优化。
总结
TradingVMA是一种自适应的量化策略。它使用特殊设计的VMA指标来捕捉市场趋势,具有响应迅速、过滤噪音的优势。该策略可以通过多种方式进行优化,以获得更好的表现。但也不能完全避免跟随偏差等问题的存在。总体来说,TradingVMA是一个非常有前景的趋势跟随策略。
/*backtest
start: 2024-01-01 00:00:00
end: 2024-01-24 23:59:59
period: 1h
basePeriod: 15m
exchanges: [{"eid":"Futures_Binance","currency":"BTC_USDT"}]
*/

// This source code is subject to the terms of the Mozilla Public License 2.0 at https://mozilla.org/MPL/2.0/
// © laptevmaxim92

//@version=4
strategy("Variable Moving Average Strategy", overlay=true)

src=close
l =input(5, title="VMA Length")
std=input(true, title="Show Trend Direction Colors")

utp = input(false, "Use take profit?")
pr = input(100, "Take profit pips")
usl = input(false, "Use stop loss?")
sl = input(100, "Stop loss pips")
fromday = input(01, defval=01, minval=01, maxval=31, title="From Day")
frommonth = input(01, defval=01, minval= 01, maxval=12, title="From Month")
fromyear = input(2000, minval=1900, maxval=2100, title="From Year")
today = input(31, defval=01, minval=01, maxval=31, title="To Day")
tomonth = input(12, defval=12, minval=01, maxval=12, title="To Month")
toyear = input(2019, minval=1900, maxval=2100, title="To Year")

use_date = (time > timestamp(fromyear, frommonth, fromday, 00, 00) and time < timestamp(toyear, tomonth, today, 00, 00))

k = 1.0/l
pdm = 0.0
pdm := max((src - src[1]), 0)
mdm = 0.0
mdm := max((src[1] - src), 0)
pdmS = 0.0
pdmS := ((1 - k)*nz(pdmS[1]) + k*pdm)
mdmS = 0.0
mdmS := ((1 - k)*nz(mdmS[1]) + k*mdm)
s = pdmS + mdmS
pdi = pdmS/s
mdi = mdmS/s
pdiS = 0.0
pdiS := ((1 - k)*nz(pdiS[1]) + k*pdi)
mdiS = 0.0
mdiS := ((1 - k)*nz(mdiS[1]) + k*mdi)
d = abs(pdiS - mdiS)
s1 = pdiS + mdiS
iS = 0.0
iS := ((1 - k)*nz(iS[1]) + k*d/s1)
hhv = highest(iS, l)
llv = lowest(iS, l)
d1 = hhv - llv
vI = (iS - llv)/d1
vma = 0.0
vma := (1 - k*vI)*nz(vma[1]) + k*vI*src
vmaC=(vma > vma[1]) ? color.lime : (vma<vma[1]) ? color.red : (vma==vma[1]) ? color.yellow : na
plot(vma, color=std?vmaC:color.white, linewidth=3, title="VMA")

longCondition = vma > vma[1]
if (longCondition)
    strategy.entry("BUY", strategy.long and use_date)

shortCondition = vma < vma[1]
if (shortCondition)
    strategy.entry("SELL", strategy.short and use_date)

if (utp and not usl)
    strategy.exit("TP", "BUY", profit = pr)
    strategy.exit("TP", "SELL", profit = pr)

if (usl and not utp)
    strategy.exit("SL", "BUY", loss = sl)
    strategy.exit("SL", "SELL", loss = sl)

if (usl and utp)
    strategy.exit("TP/SL", "BUY", loss = sl, profit = pr)
    strategy.exit("TP/SL", "SELL", loss = sl, profit = pr)