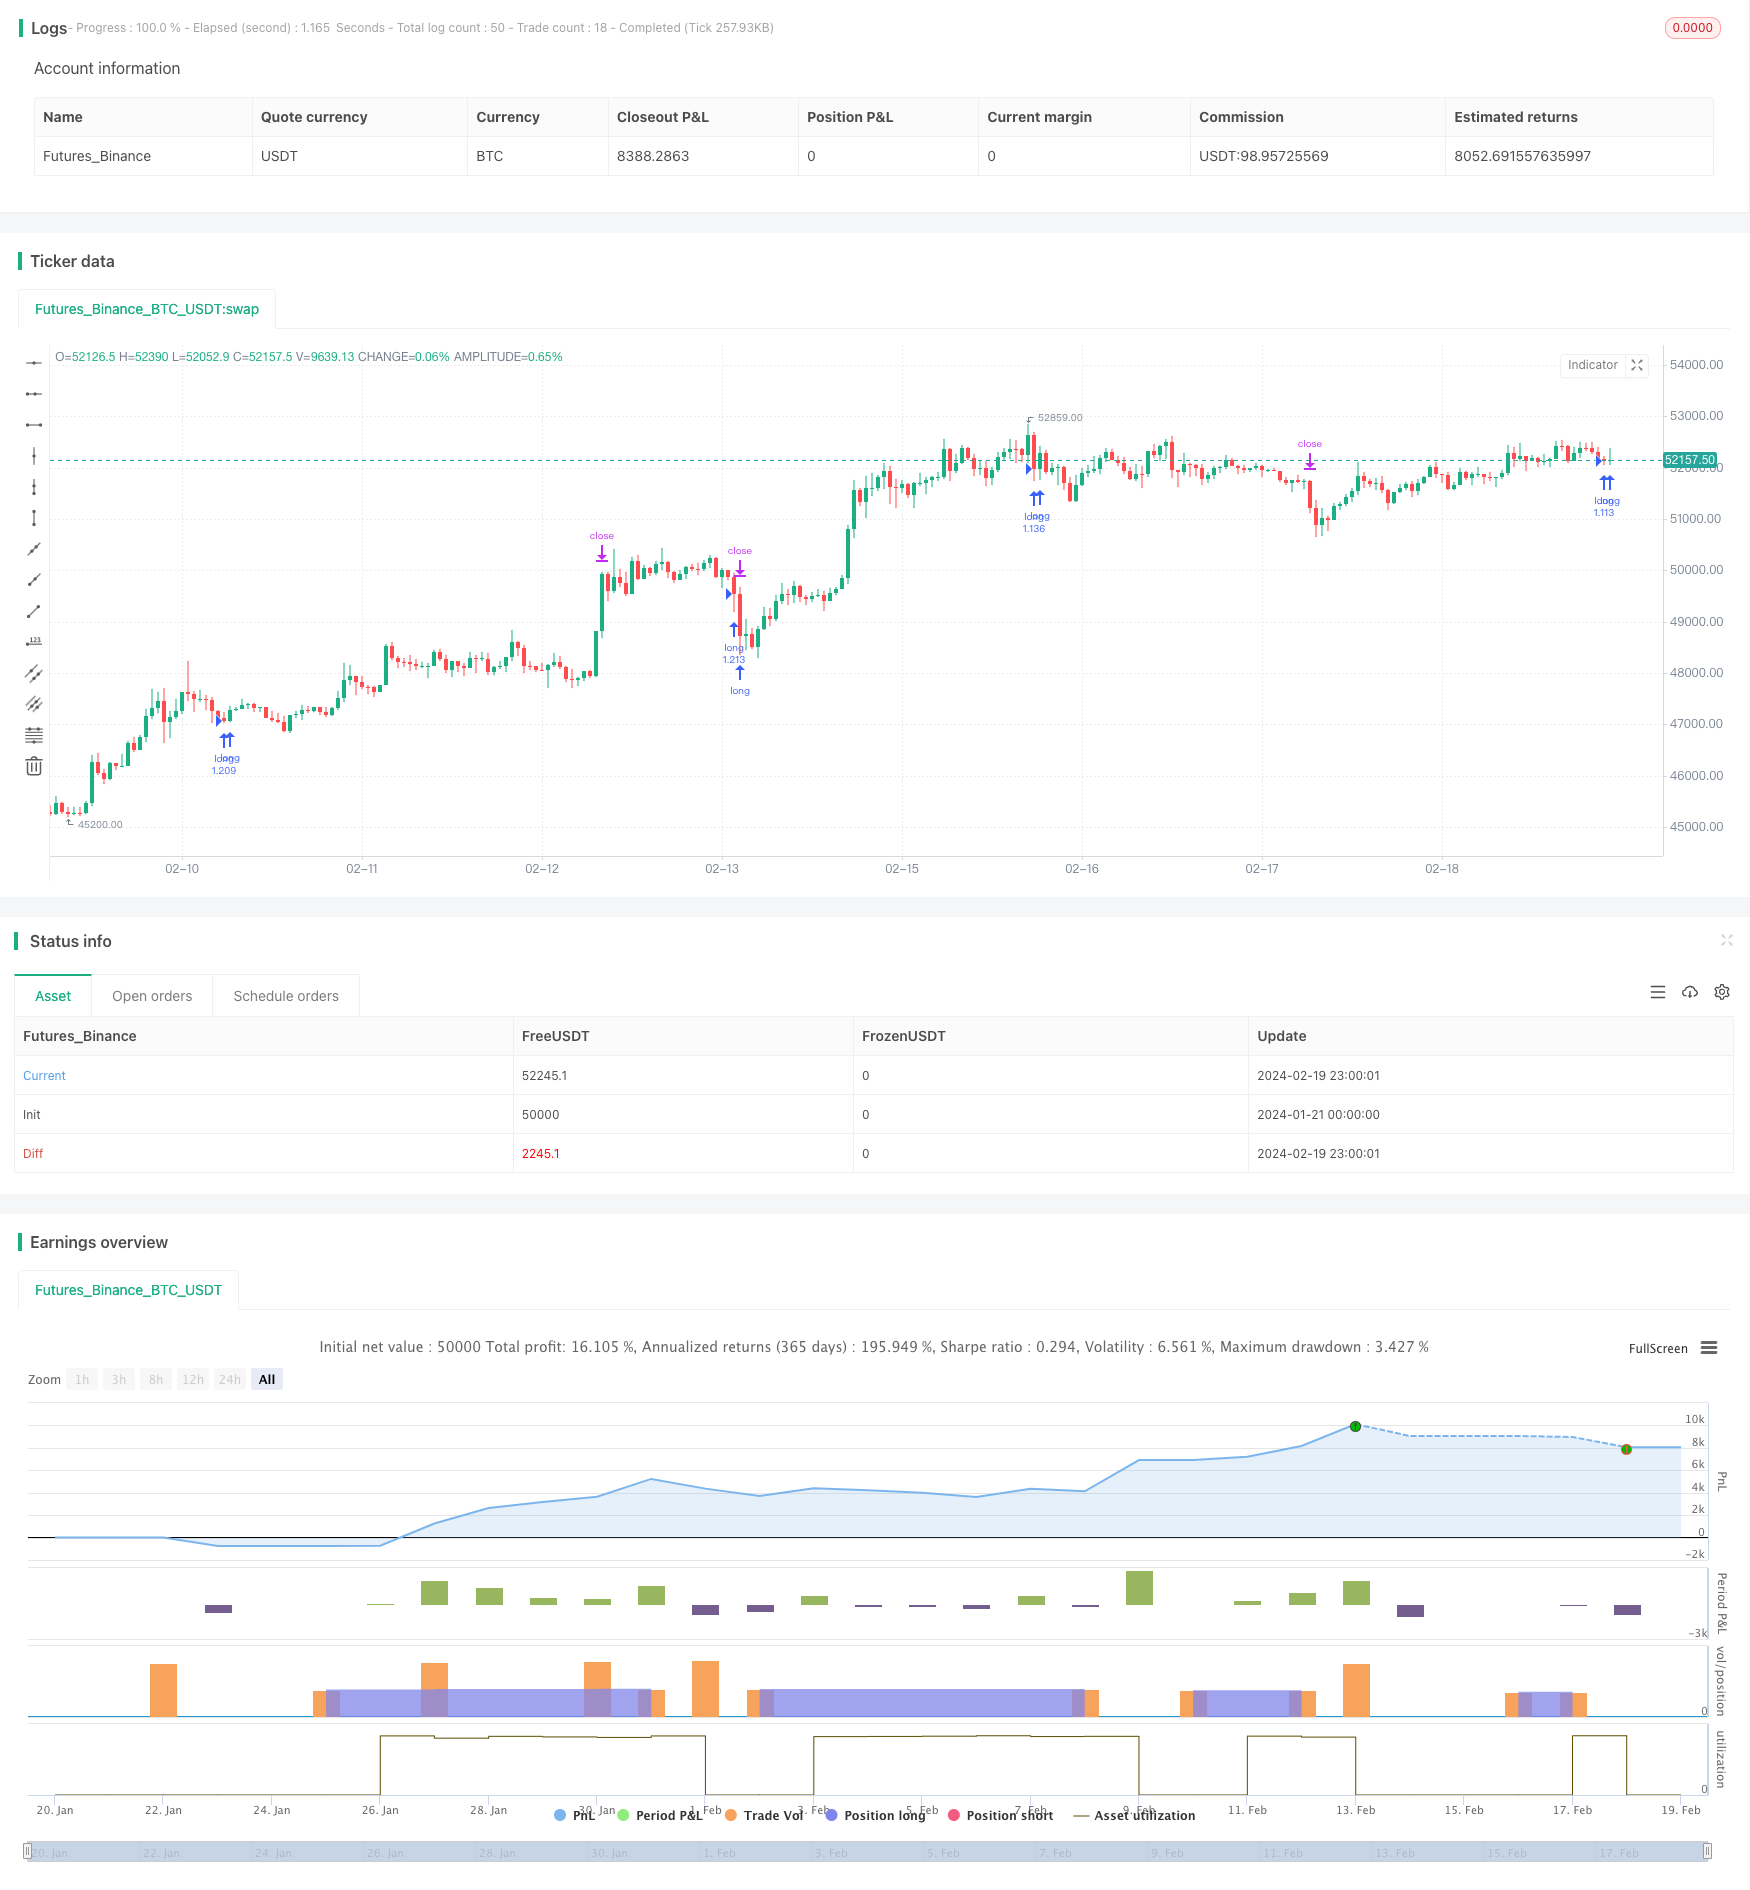
概述
本策略名称为“量化交易策略之双均线突破策略”。该策略的主要思想是利用快速移动平均线和慢速移动平均线的交叉信号,实现对价格趋势的判断,进而制定买入和卖出决策。
策略原理
该策略的核心指标为快速移动平均线和慢速移动平均线。策略利用快速移动平均线和慢速移动平均线的交叉关系来判断价格趋势,并以此制定买入和卖出决策。
具体来说,快速移动平均线参数设置为24周期,慢速移动平均线参数设置为100周期。当快速移动平均线从下方向上交叉慢速移动平均线时,表示价格进入上涨趋势,这时策略会发出买入信号;当快速移动平均线从上方向下交叉慢速移动平均线时,表示价格进入下跌趋势,这时策略会发出卖出信号。
这样,通过判断快慢移动平均线的交叉方向,可以有效捕捉价格趋势的变化,辅助制定买入卖出决策。
策略优势
该策略具有以下优势:
原理简单易懂,容易实施。双均线交叉是最基本的技术指标之一,易于理解和应用。
Parameters可调节,适应性强。快速移动平均线和慢速移动平均线的参数可根据实际情况进行调整,使策略更加灵活。
捕捉趋势变化的能力较强。双均线交叉常用于捕捉价格从盘整进入趋势的转折点。
可有效过滤震荡,减少无效交易。双均线可用来识别震荡区间,避免在震荡中重复开仓。
策略风险
该策略也存在一些风险:
双均线交叉信号可能滞后。双均线作为趋势跟踪指标,交叉信号常常会滞后一定周期。这可能导致一定程度上的机会成本。
震荡市场中容易产生虚假信号。双均线表现最佳的场景是价格存在明显趋势的情况。但在震荡行情中,则容易产生频繁的假信号。
参数设定不当可能影响策略表现。如果快慢均线参数设定不当,则会影响捕捉趋势交叉的灵敏度。
对应解决方法:
适当缩短均线周期,提高交叉信号的灵敏度。
加入波动率或交易量指标进行过滤,减少震荡市场下的无效交易。
参数优化,寻找最佳参数组合。加入机器学习等方法自动优化。
策略优化方向
该策略可从以下方面进行优化:
利用更先进的移动平均技术指标,如线性加权移动平均线等,替代简单移动平均线,提高指标的跟踪和预测能力。
加入更多辅助指标,如成交量指标、波动率指标等进行联合过滤,减少无效信号。
优化快慢均线参数,提高参数适应性。可采用机器学习、随机优化等方法寻找最优参数。
策略入场后可设计止损点和移动止损来控制单笔亏损。同时加入利润优化技术确保获取足够利润。
可利用深度学习等新技术来识别更复杂的价格模式,辅助均线交叉进行买卖决策,以期获得更优秀的效果。
总结
本策略总体来说较为经典和简单,基于双均线指标判断价格趋势,以发掘价格从震荡向趋势转化的机会。优点是思路清晰、简单实用,适合于跟踪趋势性行情。但也存在一些缺陷如信号滞后等,这需要通过参数调整和优化来提高策略的稳定性和交易效率。总的来说,本策略作为一个基础策略较为适合,但需要不断优化以适应更加复杂的市场环境。
/*backtest
start: 2024-01-21 00:00:00
end: 2024-02-20 00:00:00
period: 1h
basePeriod: 15m
exchanges: [{"eid":"Futures_Binance","currency":"BTC_USDT"}]
*/

//@version=5
strategy('Pine Script Tutorial Example Strategy 1', overlay=true, initial_capital=100000, default_qty_value=100, default_qty_type=strategy.percent_of_equity)

//OBV
src = close
obv = ta.cum(math.sign(ta.change(src)) * volume)
ma(source, length, type) =>
    switch type
        "SMA" => ta.sma(source, length)
        "EMA" => ta.ema(source, length)
        "SMMA (RMA)" => ta.rma(source, length)
        "WMA" => ta.wma(source, length)
        "VWMA" => ta.vwma(source, length)
typeMA = input.string(title = "Method", defval = "SMA", options=["SMA", "EMA", "SMMA (RMA)", "WMA", "VWMA"], group="Smoothing")
smoothingLength = input.int(title = "Length", defval = 20, minval = 1, maxval = 100, group="Smoothing")
Limit = input.float(title = "Limit", defval = 1, minval = 0.1, maxval = 10, group="Smoothing")
smoothingLine_ma = ma(obv,smoothingLength, typeMA)
obv_diff = (obv-smoothingLine_ma)*100/obv

//PVT
var cumVolp = 0.
cumVolp += nz(volume)
if barstate.islast and cumVolp == 0
    runtime.error("No volume is provided by the data vendor.")
srcp = close
vt = ta.cum(ta.change(srcp)/srcp[1]*volume)
smoothingLine_map = ma(vt,smoothingLength, typeMA)
pvt_diff = (vt-smoothingLine_map)*100/vt

// plot(obv_diff+close+100 ,title="OBV_DIFF", color = color.rgb(255, 118, 54))
// plot(pvt_diff+close+80 ,title="PVT_DIFF", color = color.rgb(223, 61, 255))

indicator = (pvt_diff+obv_diff)/2
goLongCondition1 = ta.crossover(indicator,Limit)
timePeriod = time >= timestamp(syminfo.timezone, 2023,1, 1, 0, 0)  // Backtesting Time
notInTrade = strategy.position_size <= 0
if goLongCondition1 and timePeriod and notInTrade
    stopLoss = low * 0.99 // -2%
    takeProfit = high * 1.05 // +5%
    strategy.entry('long', strategy.long )
    strategy.exit('exit', 'long', stop=stopLoss, limit=takeProfit)


// fastEMA = ta.ema(close, 24)
// slowEMA = ta.ema(close, 100)
// goLongCondition1 = ta.crossover(fastEMA, slowEMA)
// timePeriod = time >= timestamp(syminfo.timezone, 2018, 12, 15, 0, 0)
// notInTrade = strategy.position_size <= 0
// if goLongCondition1 and timePeriod and notInTrade
//     stopLoss = low * 0.97
//     takeProfit = high * 1.12
//     strategy.entry('long', strategy.long)
//     strategy.exit('exit', 'long', stop=stopLoss, limit=takeProfit)
// plot(fastEMA, color=color.new(color.blue, 0))
// plot(slowEMA, color=color.new(color.yellow, 0))