Trading Strategy Based on Multiple Time Frame EMA Breakthrough and K-line Pattern Combination

Overview
This strategy integrates multiple time frame EMA indicators and K-line pattern judgments to achieve relatively sensitive long-term signal capture and stop-loss exits.
Strategy Principle
The strategy is mainly based on the following indicators for judgment:
-
EMA: Uses 2 sets of 13 and 21 cycles of EMA to determine the trading signal when price breakthrough.
-
K-line pattern: Judges the direction of K-line entity and uses it with the EMA indicator to filter false breakthroughs.
-
Support Resistance: Constructed by the highest points in the last 10 cycles to determine if the breakthrough passes this area to enhance signal reliability.
-
Rise in Time Division: 120 cycle of close is above open to judge as rise in time division, as an auxiliary judgment.
The rules for generating trading signals are:
-
Bullish signal: Fast EMA breaks through slow EMA upwards with a Yang line K-line, close short position and open long.
-
Bearish signal: Fast EMA breaks down through slow EMA with a Yin line K-line, flatten long position.
-
Stop loss exit: Stop loss exit at current position when reverse signal appears.
Advantages
- Multiple time frame EMA indicators judge the trend more reliably and avoid false breakthroughs.
- Combined with K-line entity direction for filtering to identify trends more accurately.
- Increase time division judgments and support resistance judgments to ensure signal quality.
- Use reverse signals as stop loss to reduce risk of loss.
Risks
- Risk of invalid breakthroughs resulting in losses. Multi time frame EMA and K-line entity judgments still cannot completely avoid the impact of invalid breakthroughs on the strategy.
- Risk of inappropriate parameter selection. Improper settings of EMA cycles, K-line judgment cycles will lead to decline in signal quality.
- Risk of failure in support resistance. Historical support resistance failure is common, this will also lead to lack of momentum when signals are generated.
- Risk of time division failure. Time division situation changes and cannot completely rely on it for judgment.
The above risks can be mitigated through methods like avoiding excessive optimization, careful parameter selection, strictly controlling position sizing.
Optimization Directions
- Introduce machine learning models to assist judgment. Train classification models to judge K-line entity directions for higher accuracy.
- Increase adaptive stop loss mechanism like trailing stops or volatility based stops.
- Combine sentimental analysis. Introduce certain media opinion judgments to avoid major negative news impact.
- Add position sizing management module. Introduce fixed position sizing ratios or fund management based sizing.
Conclusion
The strategy integrates multiple time frame EMA and K-line entity judgments for relatively reliable trend judgments. Auxiliary judgments using support resistance and time division ensure signal quality. Using reverse signals for stop loss can effectively control single stop loss. Future optimizations can be done through introducing machine learning models, adaptive stops, sentimental analysis and position sizing management modules to make the strategy more robust.
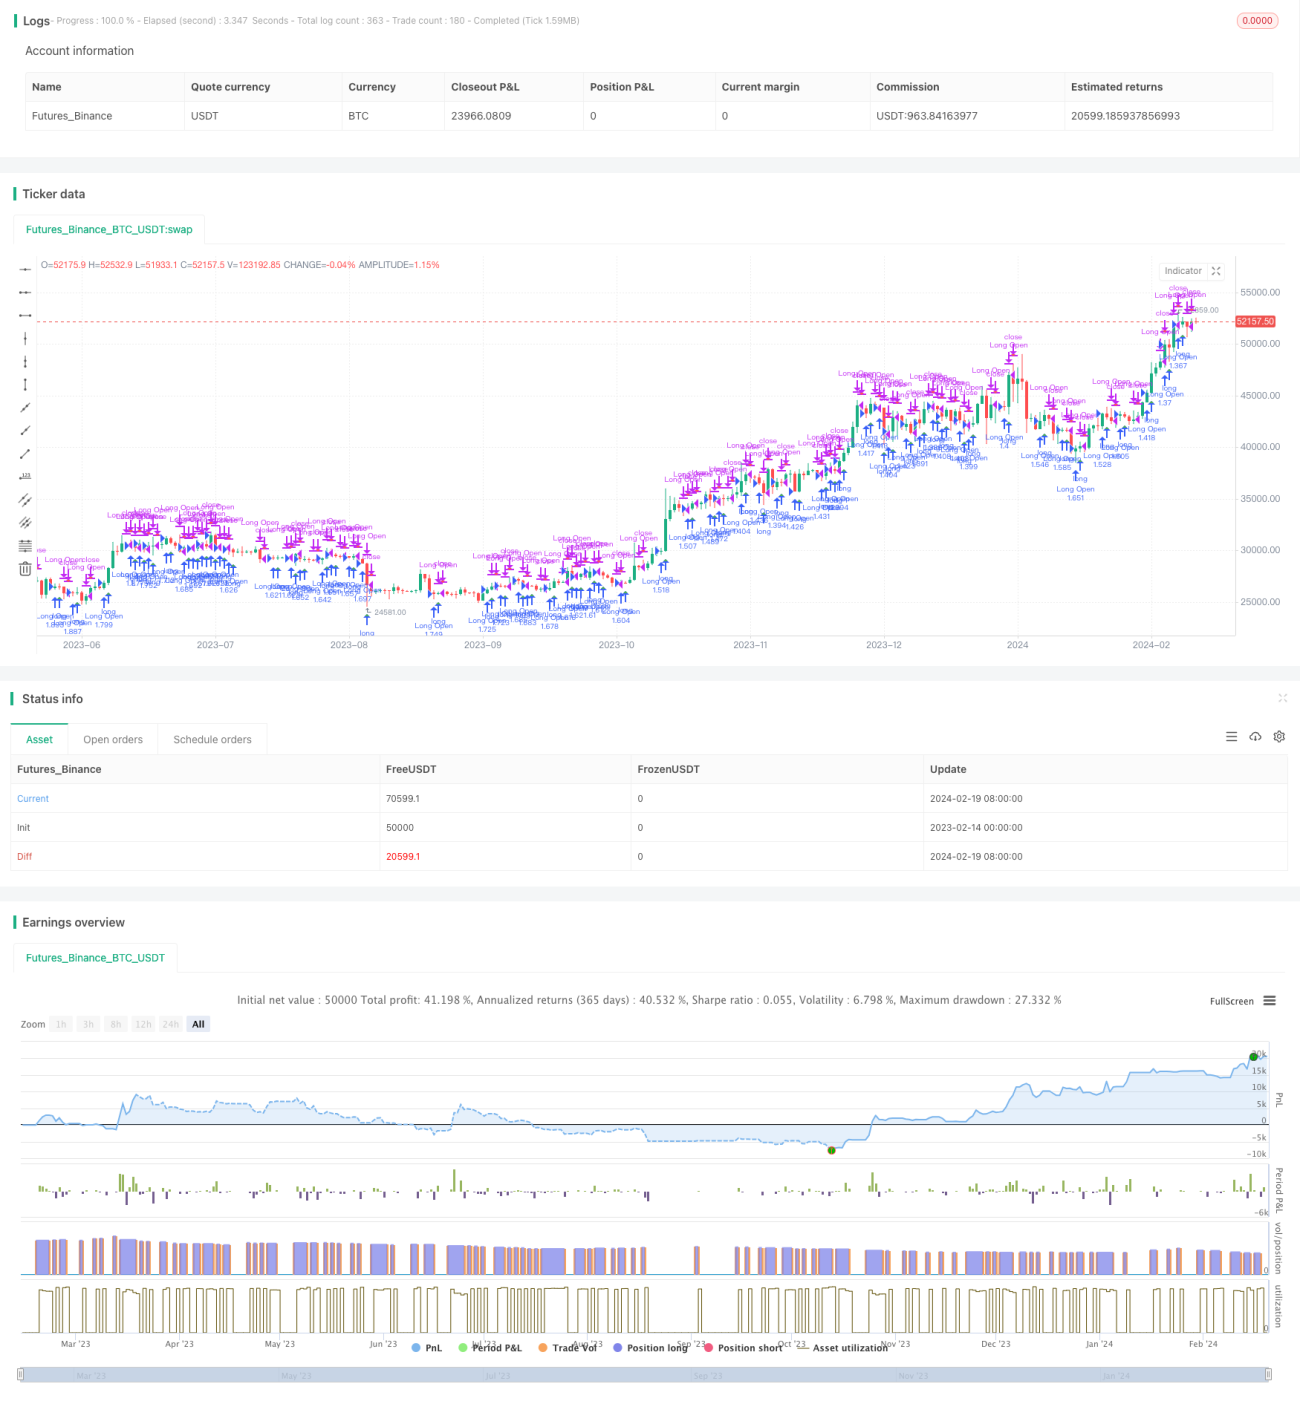
/*backtest
start: 2023-02-14 00:00:00
end: 2024-02-20 00:00:00
period: 1d
basePeriod: 1h
exchanges: [{"eid":"Futures_Binance","currency":"BTC_USDT"}]
*/

//@version=2
strategy(title='ck - CryptoSniper Longs Only (Strategy)', shorttitle='ck - CryptoSniper Longs (S) v1', overlay=true, precision=2, commission_value=0.25, default_qty_type=strategy.percent_of_equity, pyramiding=0, default_qty_value=100, initial_capital=100)

open_long = 0- 1