概述
该策略是一个基于简单移动平均线的组合交易策略。它使用9日线和21日线的均线交叉作为买入和卖出信号。当短期均线从下方上穿长期均线时产生买入信号;当短期均线从上方下穿长期均线时产生卖出信号。
策略原理
这个策略的核心逻辑是使用两个不同参数的简单移动平均线,一个是9日线代表短期趋势,一个是21日线代表长期趋势。当短期趋势线从下方上穿长期趋势线的时候,表示行情从下跌转为上涨,这时产生买入信号;当短期趋势线从上方下穿长期趋势线时,表示行情从上涨转为下跌,这时产生卖出信号。
该策略主要依赖均线的“黄金交叉”和“死亡交叉”两个信号。所谓“黄金交叉”是短期均线从下向上突破长期均线,表示行情可能从下跌转为上涨;“死亡交叉”则是短期均线从上向下跌破长期均线,预示着行情即将从上涨转为下跌。这个策略就是利用这两个信号判断行情的长短期趋势关系,产生买入和卖出决策。
策略优势
- 操作简单,容易理解使用
- 参数少,不需要大量测试和优化
- 交易频率适中,避免过于激进
- 能相对准确地捕捉长短期趋势的转折点
- 具有一定的可测性和稳定性
策略风险
- 双均线策略容易产生错误信号和频繁切换
- 买卖点选择和参数设定依赖经验,不够系统化
- 效果与参数选择高度相关,9和21天线并非最优
- 无法有效过滤震荡行情的噪音交易
- 大幅震荡行情中表现不佳,容易损失
可以通过如下方法来优化和改进: 1. 增加过滤机制,避免错误信号 2. 结合其他指标判断趋势信号的可靠性 3. 根据不同品种和参数进行测试优化 4. 设置止损止盈逻辑,控制风险
总结
该策略整体来说是一个较为传统和简单的双均线组合策略。它易于理解和实现,参数选择也比较简单,能够有效跟踪长短期趋势的转换。但是该策略也存在一些问题,如产生误信号,PARAMETERS选择经验化,大幅震荡行情中的表现较差等。这需要我们在使用的时候注重风险控制,并进行适当的优化、改进和组合。
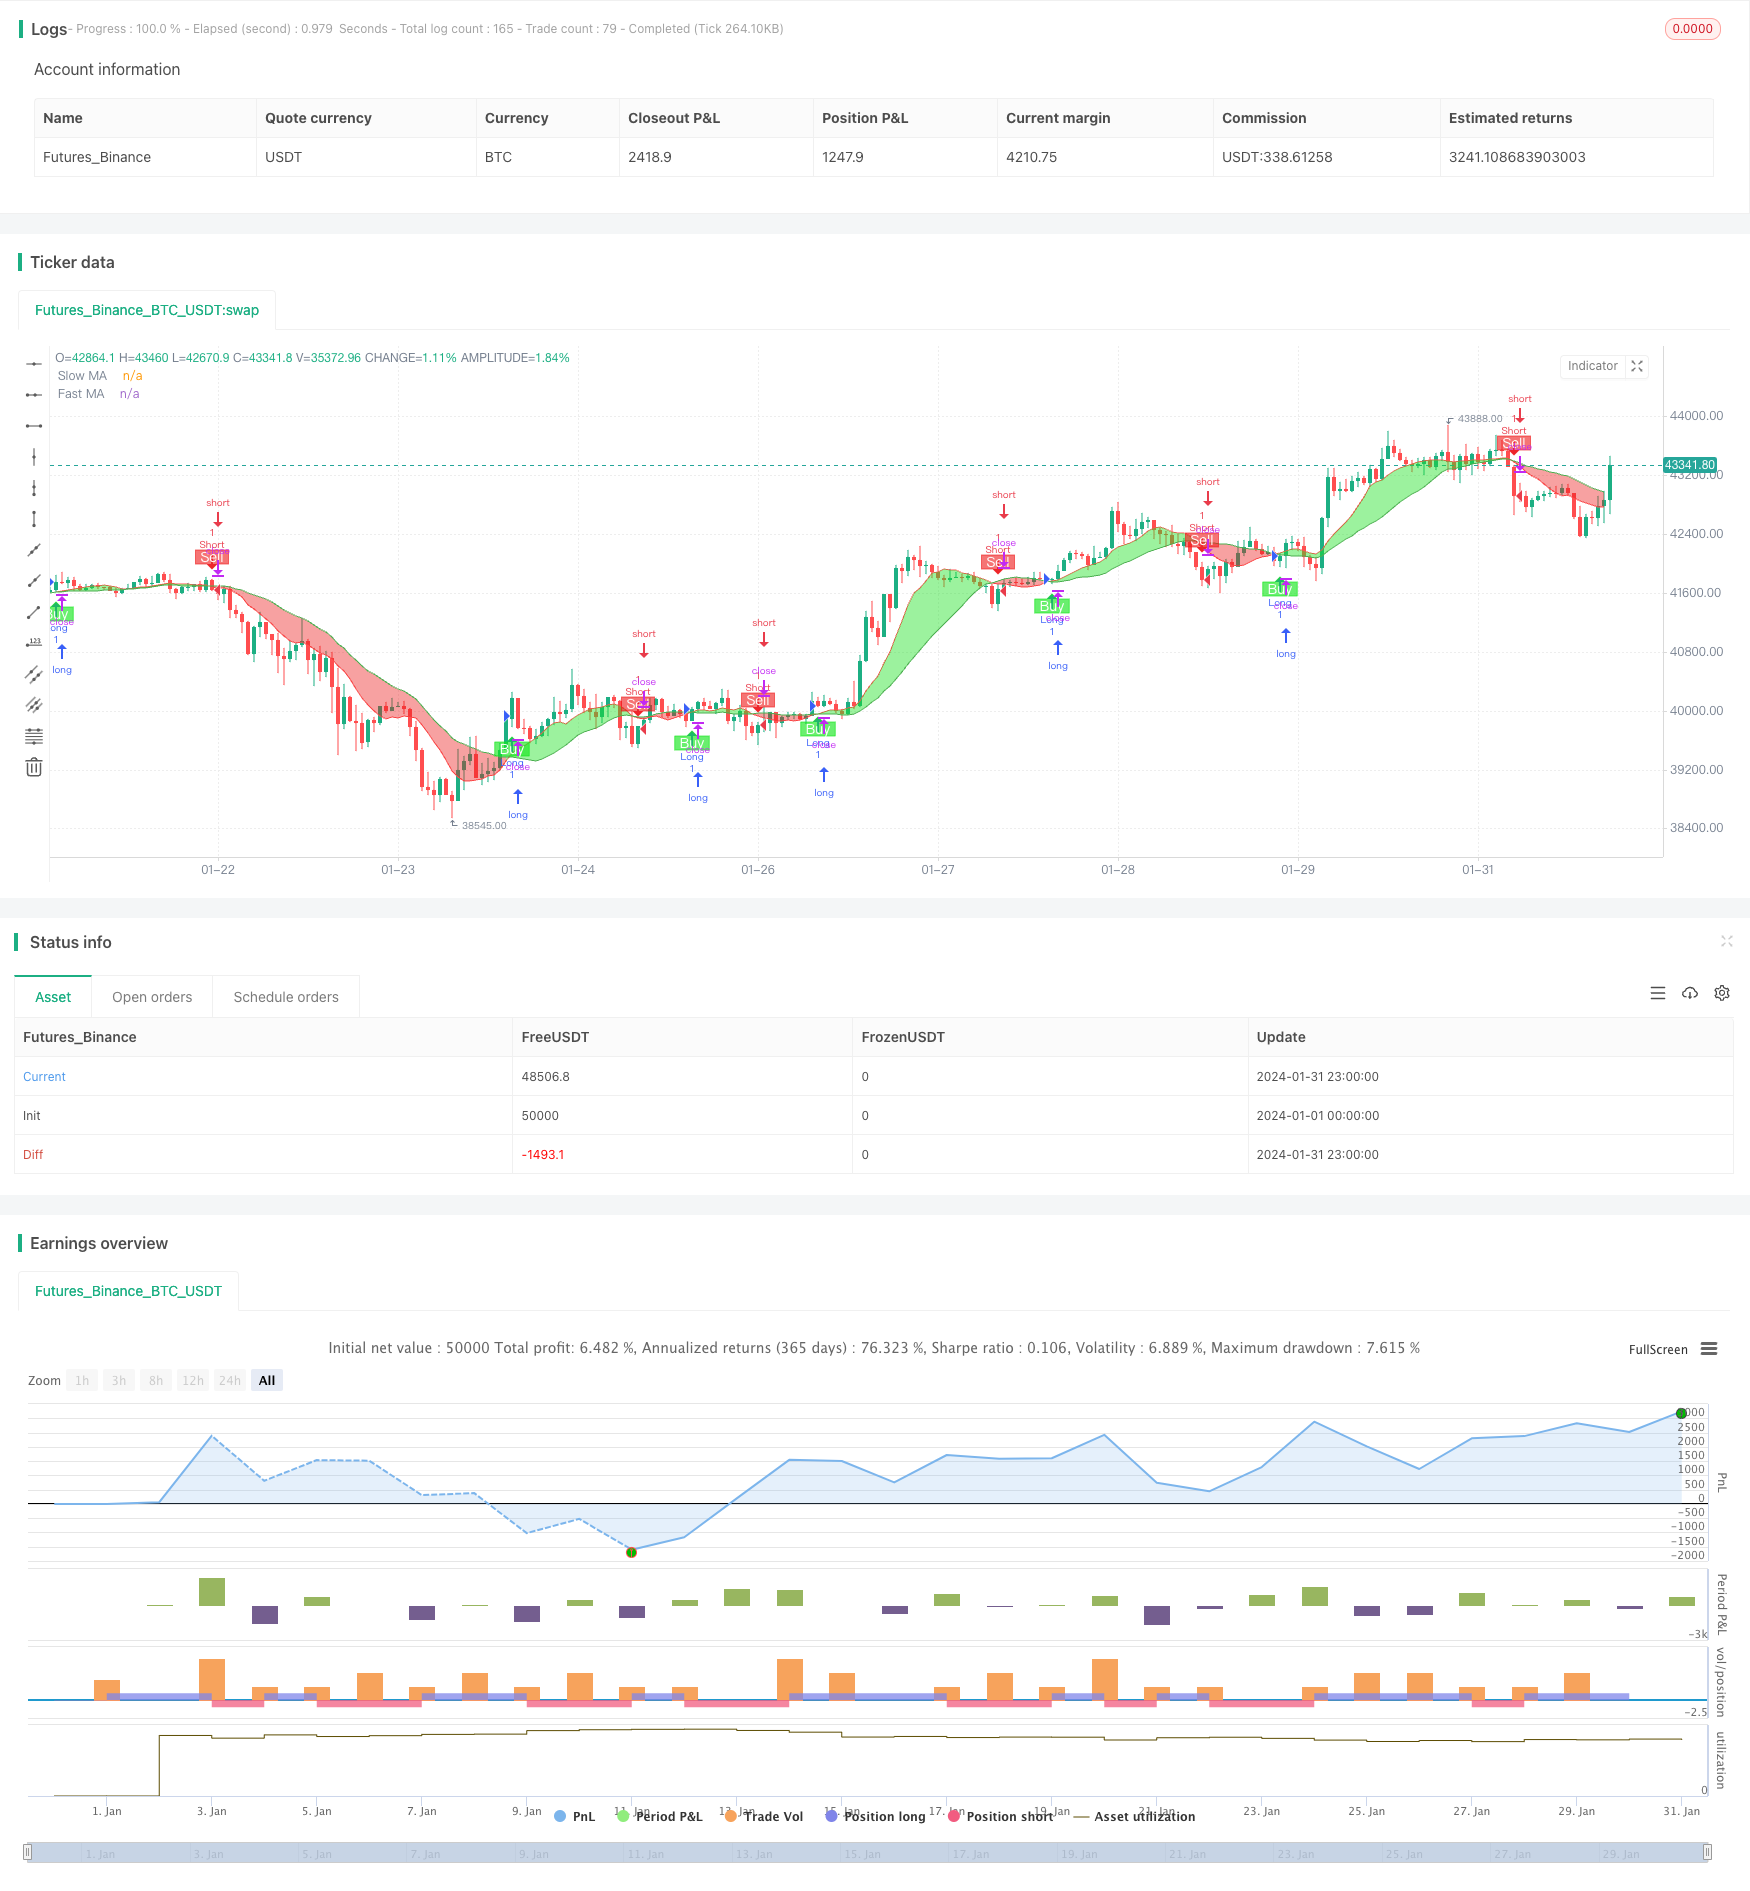
策略源码
/*backtest
start: 2024-01-01 00:00:00
end: 2024-01-31 23:59:59
period: 1h
basePeriod: 15m
exchanges: [{"eid":"Futures_Binance","currency":"BTC_USDT"}]
*/

//@version=5
strategy("Bitboy Strategy", overlay=true)

// Define MAs
SlowMA = ta.sma(close, 9)
FastMA = ta.sma(close, 21)

// Plot MAs
plot1 = plot(SlowMA, color=color.new(color.red, 0), title="Slow MA")
plot2 = plot(FastMA, color=color.new(color.green, 0), title="Fast MA")

// Plot MA Ribbon
fill(plot1, plot2, color=FastMA > SlowMA ? color.rgb(233, 21, 21, 50) : color.new(#1de223, 45))

// Define buy/sell conditions
longCondition = ta.crossover(SlowMA, FastMA)
shortCondition = ta.crossunder(SlowMA, FastMA)

// Strategy commands for buy/sell
if longCondition
    strategy.entry("Long", strategy.long)

if shortCondition
    strategy.entry("Short", strategy.short)

// Plot buy/sell signals (for visualization)
plotshape(longCondition, location=location.belowbar, color=color.rgb(18, 230, 25, 37), style=shape.labelup, text="Buy", textcolor=color.white)
plotshape(shortCondition, location=location.abovebar, color=color.rgb(239, 23, 23, 40), style=shape.labeldown, text="Sell", textcolor=color.white)