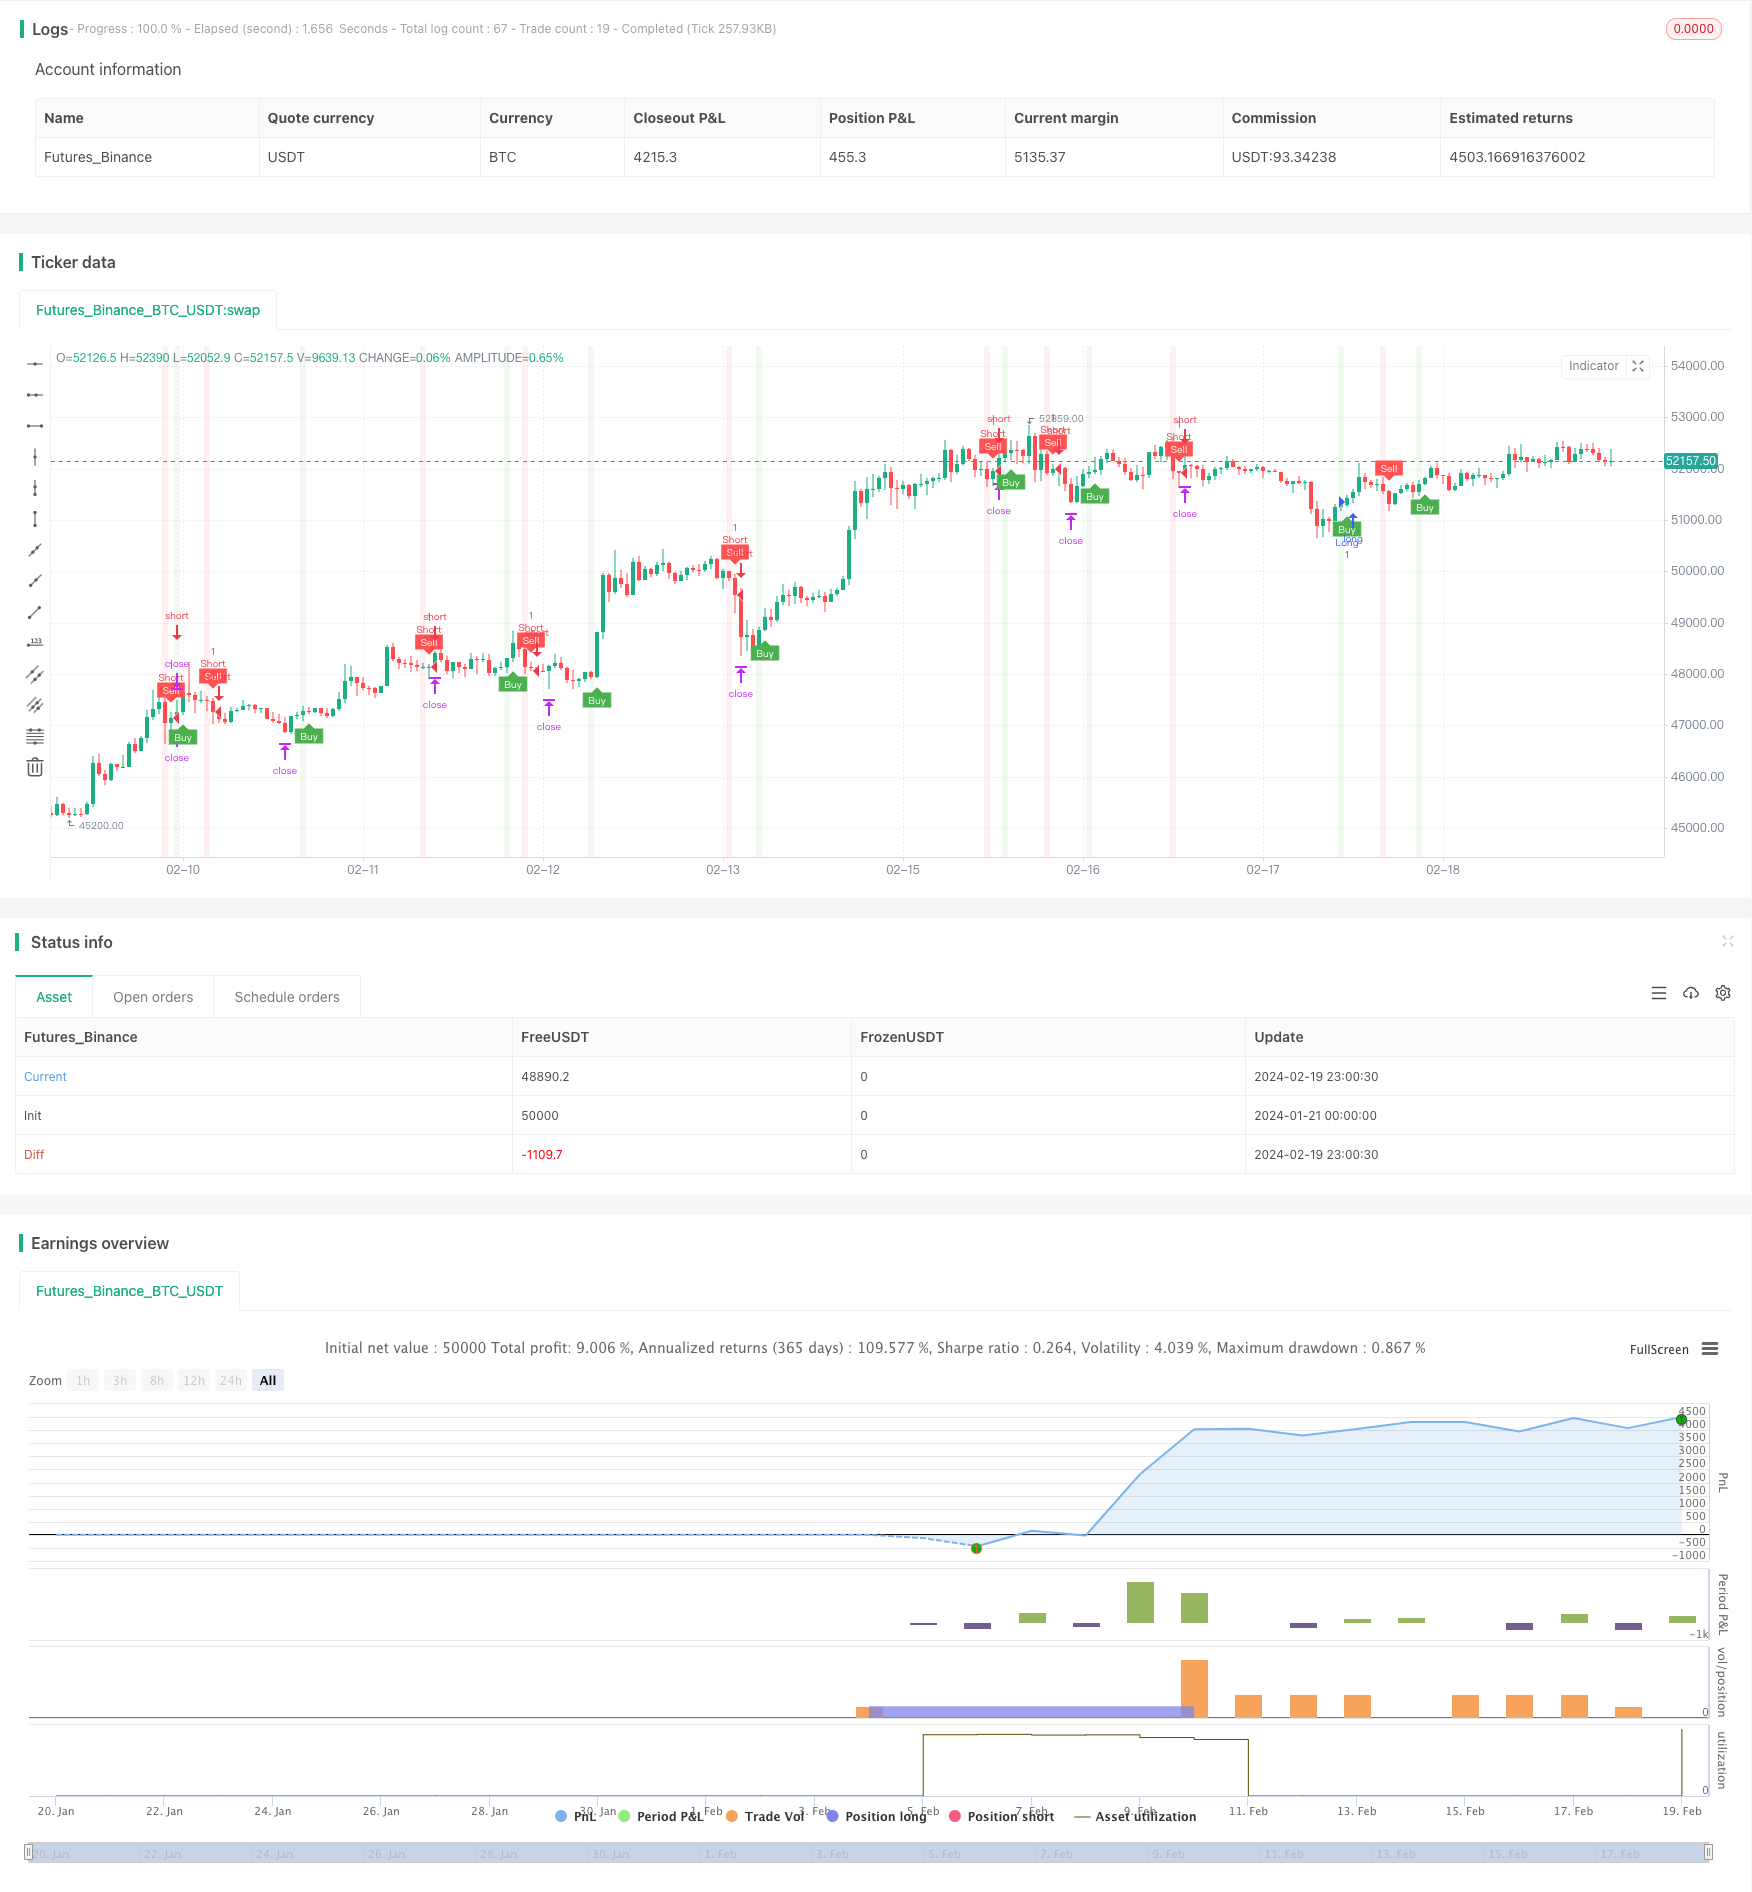
概述
本策略的核心思想是利用T3均线和ATR自适应移动止损来捕捉趋势上的进出场点,属于趋势跟踪类策略。当价格突破T3均线时产生交易信号,并在突破点使用ATR值设置止损位和止盈位,实现自动止损止盈。
策略原理
该策略主要由T3均线指标、ATR指标和ATR移动止损机制组成。
T3均线是一种具有平滑性的移动平均线,可以减少曲线的滞后性,使其更快地对价格变动做出反应。当价格从均线下方向上突破时,产生买入信号;当价格从均线上方向下突破时,产生卖出信号。
ATR指标用于计算市场波动程度和设置止损位。ATR值越大,表示市场波动越大,此时需要设置更宽的止损;ATR值越小,表示市场波动越小,可以设置更窄的止损。
ATR移动止损机制,是根据ATR值实时调整止损线的位置,使止损线能够跟随价格运行并保持在合理范围内。这样既防止止损距离过近被震出,也防止止损距离过宽无法有效控制风险。
综合利用T3指标判断方向、ATR指标计算波动性和ATR移动止损机制,该策略实现了较为高效的趋势捕捉和风险控制。
优势
该策略具有以下优势:
T3均线的应用提高了捕捉趋势的准确性。
ATR指标动态计算市场波动率,止损位和止盈位更合理。
ATR移动止损机制,使止损线能够实时跟随价格运行,有效控制风险。
整合指标判断和止损机制,实现自动化趋势跟踪交易。
可以通过webhook连接外部交易平台,实现自动化下单。
风险及解决方法
该策略也存在一些风险:
T3均线参数设置不当,可能错过较优趋势机会。可以测试不同周期的参数,找到最优参数。
ATR值计算不准确,止损距离过大或过小,无法有效控制风险。可以结合市场波动率特征调整ATR周期参数。
在剧烈波动中,止损线可能被突破导致过度亏损。可以设置合理的总亏损线,避免单笔亏损过大。
双向反复行情中,可能出现止损频繁被触发的情况。可以适当放宽ATR移动止损的距离。
优化方向
该策略可以从以下几个方面进行优化:
对T3均线参数进行优化,找到最合适的平滑周期。
测试不同的ATR周期参数,计算出最能反映市场波动率的ATR值。
优化ATR移动止损距离的弹性区间,防止止损过于敏感。
添加适当过滤条件,避免双向震荡市的频繁交易。
结合趋势判断指标,提高获利方向的判断准确率。
利用机器学习方法自动优化参数。
总结
本策略整合运用T3均线判断趋势方向、ATR指标计算止损止盈和ATR移动止损机制调整止损距离,实现对趋势的自动跟踪与高效风险控制,是一种可靠的趋势跟踪策略。在实际应用中,仍需要不断测试与优化,找到最适合当前市场环境的参数组合,从而获得较好的策略效果。
/*backtest
start: 2024-01-21 00:00:00
end: 2024-02-20 00:00:00
period: 1h
basePeriod: 15m
exchanges: [{"eid":"Futures_Binance","currency":"BTC_USDT"}]
*/

//@version=5
strategy(title='UT Bot Alerts (QuantNomad) Strategy', overlay=true)
T3 = input(100)//600
// Input for Long Settings
// Input for Long Settings


xPrice3 = close
xe1 = ta.ema(xPrice3, T3)
xe2 = ta.ema(xe1, T3)
xe3 = ta.ema(xe2, T3)
xe4 = ta.ema(xe3, T3)
xe5 = ta.ema(xe4, T3)
xe6 = ta.ema(xe5, T3)

b3 = 0.7
c1 = -b3*b3*b3
c2 = 3*b3*b3+3*b3*b3*b3
c3 = -6*b3*b3-3*b3-3*b3*b3*b3
c4 = 1+3*b3+b3*b3*b3+3*b3*b3
nT3Average = c1 * xe6 + c2 * xe5 + c3 * xe4 + c4 * xe3

//plot(nT3Average, color=color.white, title="T3")

// Buy Signal - Price is below T3 Average
buySignal3 = xPrice3 < nT3Average
sellSignal3 = xPrice3 > nT3Average
// Inputs
a = input(1, title='Key Value. "This changes the sensitivity"')
c = input(50, title='ATR Period')
h = input(true, title='Signals from Heikin Ashi Candles')
riskRewardRatio = input(1, title='Risk Reward Ratio')

xATR = ta.atr(c)
nLoss = a * xATR

src = h ? request.security(ticker.heikinashi(syminfo.tickerid), timeframe.period, close, lookahead=barmerge.lookahead_off) : close

xATRTrailingStop = 0.0
iff_1 = src > nz(xATRTrailingStop[1], 0) ? src - nLoss : src + nLoss
iff_2 = src < nz(xATRTrailingStop[1], 0) and src[1] < nz(xATRTrailingStop[1], 0) ? math.min(nz(xATRTrailingStop[1]), src + nLoss) : iff_1
xATRTrailingStop := src > nz(xATRTrailingStop[1], 0) and src[1] > nz(xATRTrailingStop[1], 0) ? math.max(nz(xATRTrailingStop[1]), src - nLoss) : iff_2

pos = 0
iff_3 = src[1] > nz(xATRTrailingStop[1], 0) and src < nz(xATRTrailingStop[1], 0) ? -1 : nz(pos[1], 0)
pos := src[1] < nz(xATRTrailingStop[1], 0) and src > nz(xATRTrailingStop[1], 0) ? 1 : iff_3

xcolor = pos == -1 ? color.red : pos == 1 ? color.green : color.blue

ema = ta.ema(src, 1)
above = ta.crossover(ema, xATRTrailingStop)
below = ta.crossunder(ema, xATRTrailingStop)

buy = src > xATRTrailingStop and above
sell = src < xATRTrailingStop and below

barbuy = src > xATRTrailingStop
barsell = src < xATRTrailingStop

plotshape(buy, title='Buy', text='Buy', style=shape.labelup, location=location.belowbar, color=color.new(color.green, 0), textcolor=color.new(color.white, 0), size=size.tiny)
plotshape(sell, title='Sell', text='Sell', style=shape.labeldown, location=location.abovebar, color=color.new(color.red, 0), textcolor=color.new(color.white, 0), size=size.tiny)

barcolor(barbuy ? color.new(color.green, 90) : na)
barcolor(barsell ? color.new(color.red, 90) : na)

var float entryPrice = na
var float takeProfitLong = na
var float stopLossLong = na
var float takeProfitShort = na
var float stopLossShort = na

if buy and buySignal3
    entryPrice := src
    takeProfitLong := entryPrice + nLoss * riskRewardRatio
    stopLossLong := entryPrice - nLoss
    takeProfitShort := na
    stopLossShort := na

if sell and sellSignal3
    entryPrice := src
    takeProfitShort := entryPrice - nLoss * riskRewardRatio
    stopLossShort := entryPrice + nLoss
    takeProfitLong := na
    stopLossLong := na

// Strategy order conditions
acct = "Sim101"
ticker = "ES 12-23"
qty = 1

OCOMarketLong = '{ "alert": "OCO Market Long", "account": "' + str.tostring(acct) + '", "ticker": "' + str.tostring(ticker) + '", "qty": "' + str.tostring(qty) + '", "take_profit_price": "' + str.tostring(takeProfitLong) + '", "stop_price": "' + str.tostring(stopLossLong) + '", "tif": "DAY" }'
OCOMarketShort = '{ "alert": "OCO Market Short", "account": "' + str.tostring(acct) + '", "ticker": "' + str.tostring(ticker) + '", "qty": "' + str.tostring(qty) + '", "take_profit_price": "' + str.tostring(takeProfitShort) + '", "stop_price": "' + str.tostring(stopLossShort) + '", "tif": "DAY" }'
CloseAll = '{ "alert": "Close All", "account": "' + str.tostring(acct) + '", "ticker": "' + str.tostring(ticker) + '" }'

strategy.entry("Long", strategy.long, when=buy and buySignal3, alert_message=OCOMarketLong)
strategy.entry("Short", strategy.short, when=sell and sellSignal3, alert_message=OCOMarketShort)

// Setting the take profit and stop loss for long trades
strategy.exit("Take Profit/Stop Loss", "Long", stop=stopLossLong, limit=takeProfitLong,alert_message=CloseAll)

// Setting the take profit and stop loss for short trades
strategy.exit("Take Profit/Stop Loss", "Short", stop=stopLossShort, limit=takeProfitShort,alert_message=CloseAll)

// Plot trade setup boxes
bgcolor(buy ? color.new(color.green, 90) : na, transp=0, offset=-1)
bgcolor(sell ? color.new(color.red, 90) : na, transp=0, offset=-1)

longCondition = buy and not na(entryPrice)
shortCondition = sell and not na(entryPrice)

// var line longTakeProfitLine = na
// var line longStopLossLine = na
// var line shortTakeProfitLine = na
// var line shortStopLossLine = na

// if longCondition
//     longTakeProfitLine := line.new(bar_index, takeProfitLong, bar_index + 1, takeProfitLong, color=color.green, width=2)
//     longStopLossLine := line.new(bar_index, stopLossLong, bar_index + 1, stopLossLong, color=color.red, width=2)
//     // label.new(bar_index + 1, takeProfitLong, str.tostring(takeProfitLong, "#.#####"), color=color.green, style=label.style_none, textcolor=color.green, size=size.tiny)
//     // label.new(bar_index + 1, stopLossLong, str.tostring(stopLossLong, "#.#####"), color=color.red, style=label.style_none, textcolor=color.red, size=size.tiny)

// if shortCondition
//     shortTakeProfitLine := line.new(bar_index, takeProfitShort, bar_index + 1, takeProfitShort, color=color.green, width=2)
//     shortStopLossLine := line.new(bar_index, stopLossShort, bar_index + 1, stopLossShort, color=color.red, width=2)
//     // label.new(bar_index + 1, takeProfitShort, str.tostring(takeProfitShort, "#.#####"), color=color.green, style=label.style_none, textcolor=color.green, size=size.tiny)
//     // label.new(bar_index + 1, stopLossShort, str.tostring(stopLossShort, "#.#####"), color=color.red, style=label.style_none, textcolor=color.red, size=size.tiny)

alertcondition(buy, 'UT Long', 'UT Long')
alertcondition(sell, 'UT Short', 'UT Short')