Reversal Trading Strategy with EMA Crossover and Bollinger Bands

Overview
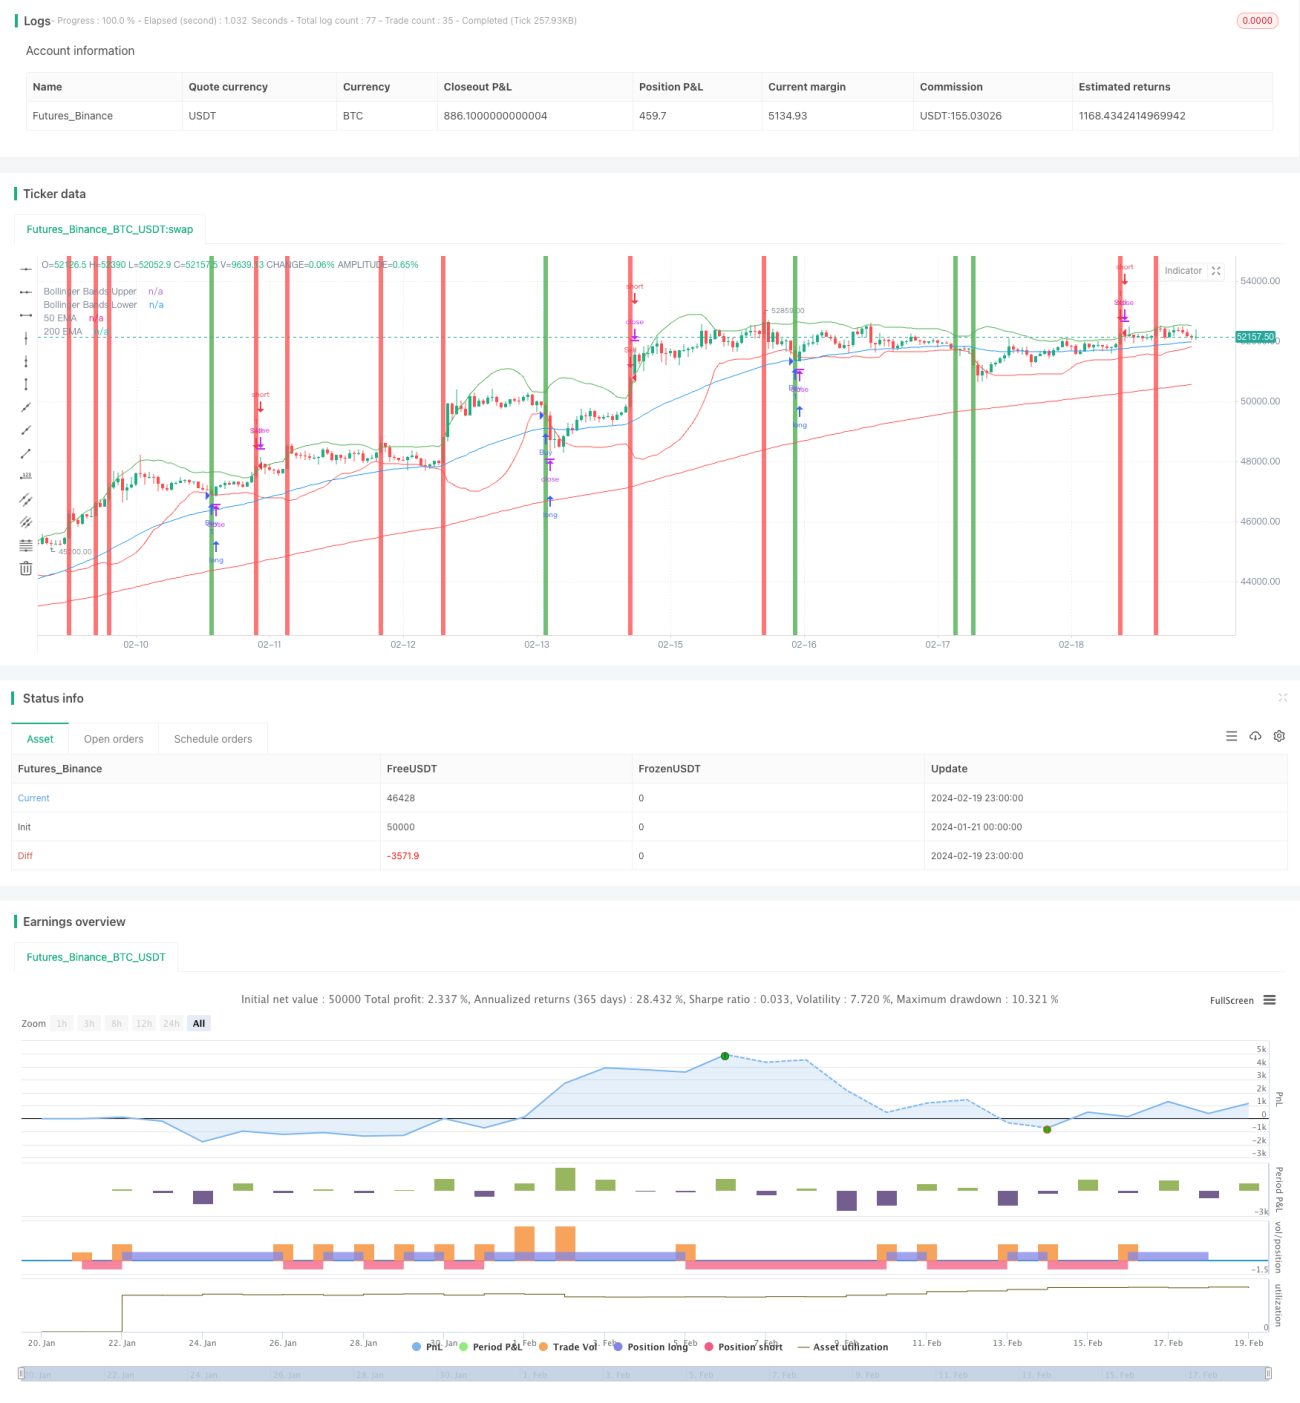
This strategy calculates two EMA lines with different periods to determine the long-term and short-term trend of the stock price. It also incorporates the upper and lower rails of the Bollinger Bands to judge whether the stock price is in an overbought or oversold state, as signals for entry and exit. It combines multiple technical indicators such as moving averages and Bollinger Bands to locate market reversal points, which belongs to a typical trend-following and reversal trading strategy.
Strategy Logic
-
Calculate the fast EMA (50-period) and slow EMA (200-period). The fast EMA crossing above the slow EMA is a buy signal, while the fast EMA crossing below is a sell signal.
-
Calculate the 20-period Bollinger Bands upper and lower rails.
-
When the price breaks through the BB upper rail, it is considered an overbought signal to go short. When the price breaks through the BB lower rail, it is considered an oversold signal to go long.
-
Combine the EMA crossovers and BB breakout signals to determine entries and exits.
The above logic is the main way this strategy identifies trading signals. It goes long when the fast EMA crosses over the slow EMA or when the price breaks the BB lower rail. It goes short when the fast EMA crosses below the slow EMA or when the price breaks the BB upper rail.
Advantage Analysis
This is a typical strategy combining multiple technical indicators, which considers both long-term and short-term price trends, as well as overbought and oversold conditions. The main advantages are:
-
EMA crossovers can effectively determine long-term and short-term trends.
-
Bollinger Bands can identify overbought and oversold zones to avoid chasing tops and bottoms.
-
Combining indicators improves robustness and avoids false signals.
-
Backtest results can be further enhanced through parameter tuning.
Risk Analysis
There are some risks with this strategy:
-
EMA may have lagging effect, missing best entry points.
-
Improper BB parameter selection may miss trends.
-
Too many combined signals increases complexity.
-
Parameters may fail when market regimes change.
Solutions:
-
Optimize parameters adaptive to markets.
-
Add stop loss to control risks.
-
Test different EMA and BB parameter combinations.
-
Further enhancements such as combining with RSI.
Optimization Directions
There is strong potential to optimize this strategy:
-
Test more EMA and BB parameter combinations.
-
Incorporate other indicators like MACD, KDJ, RSI.
-
Add trailing stop loss.
-
Test the strategy across different time frames.
-
Combine with unusual volume for more signals.
Through robust backtesting across different parameters and indicators, the strategy can be further improved for stability and profitability.
Conclusion
This strategy builds upon the two most important technical indicators EMA and Bollinger Bands to identify long-term/short-term trends and overbought/oversold levels, making it highly practical. Further parameter tuning and combining more indicators can lead to better results. It reflects the key idea in quantitative trading strategies to assess the market condition, design rules, and optimize the strategy. With continuous testing and enhancement, this strategy has the potential to become a reliable algorithmic trading system.
- 1