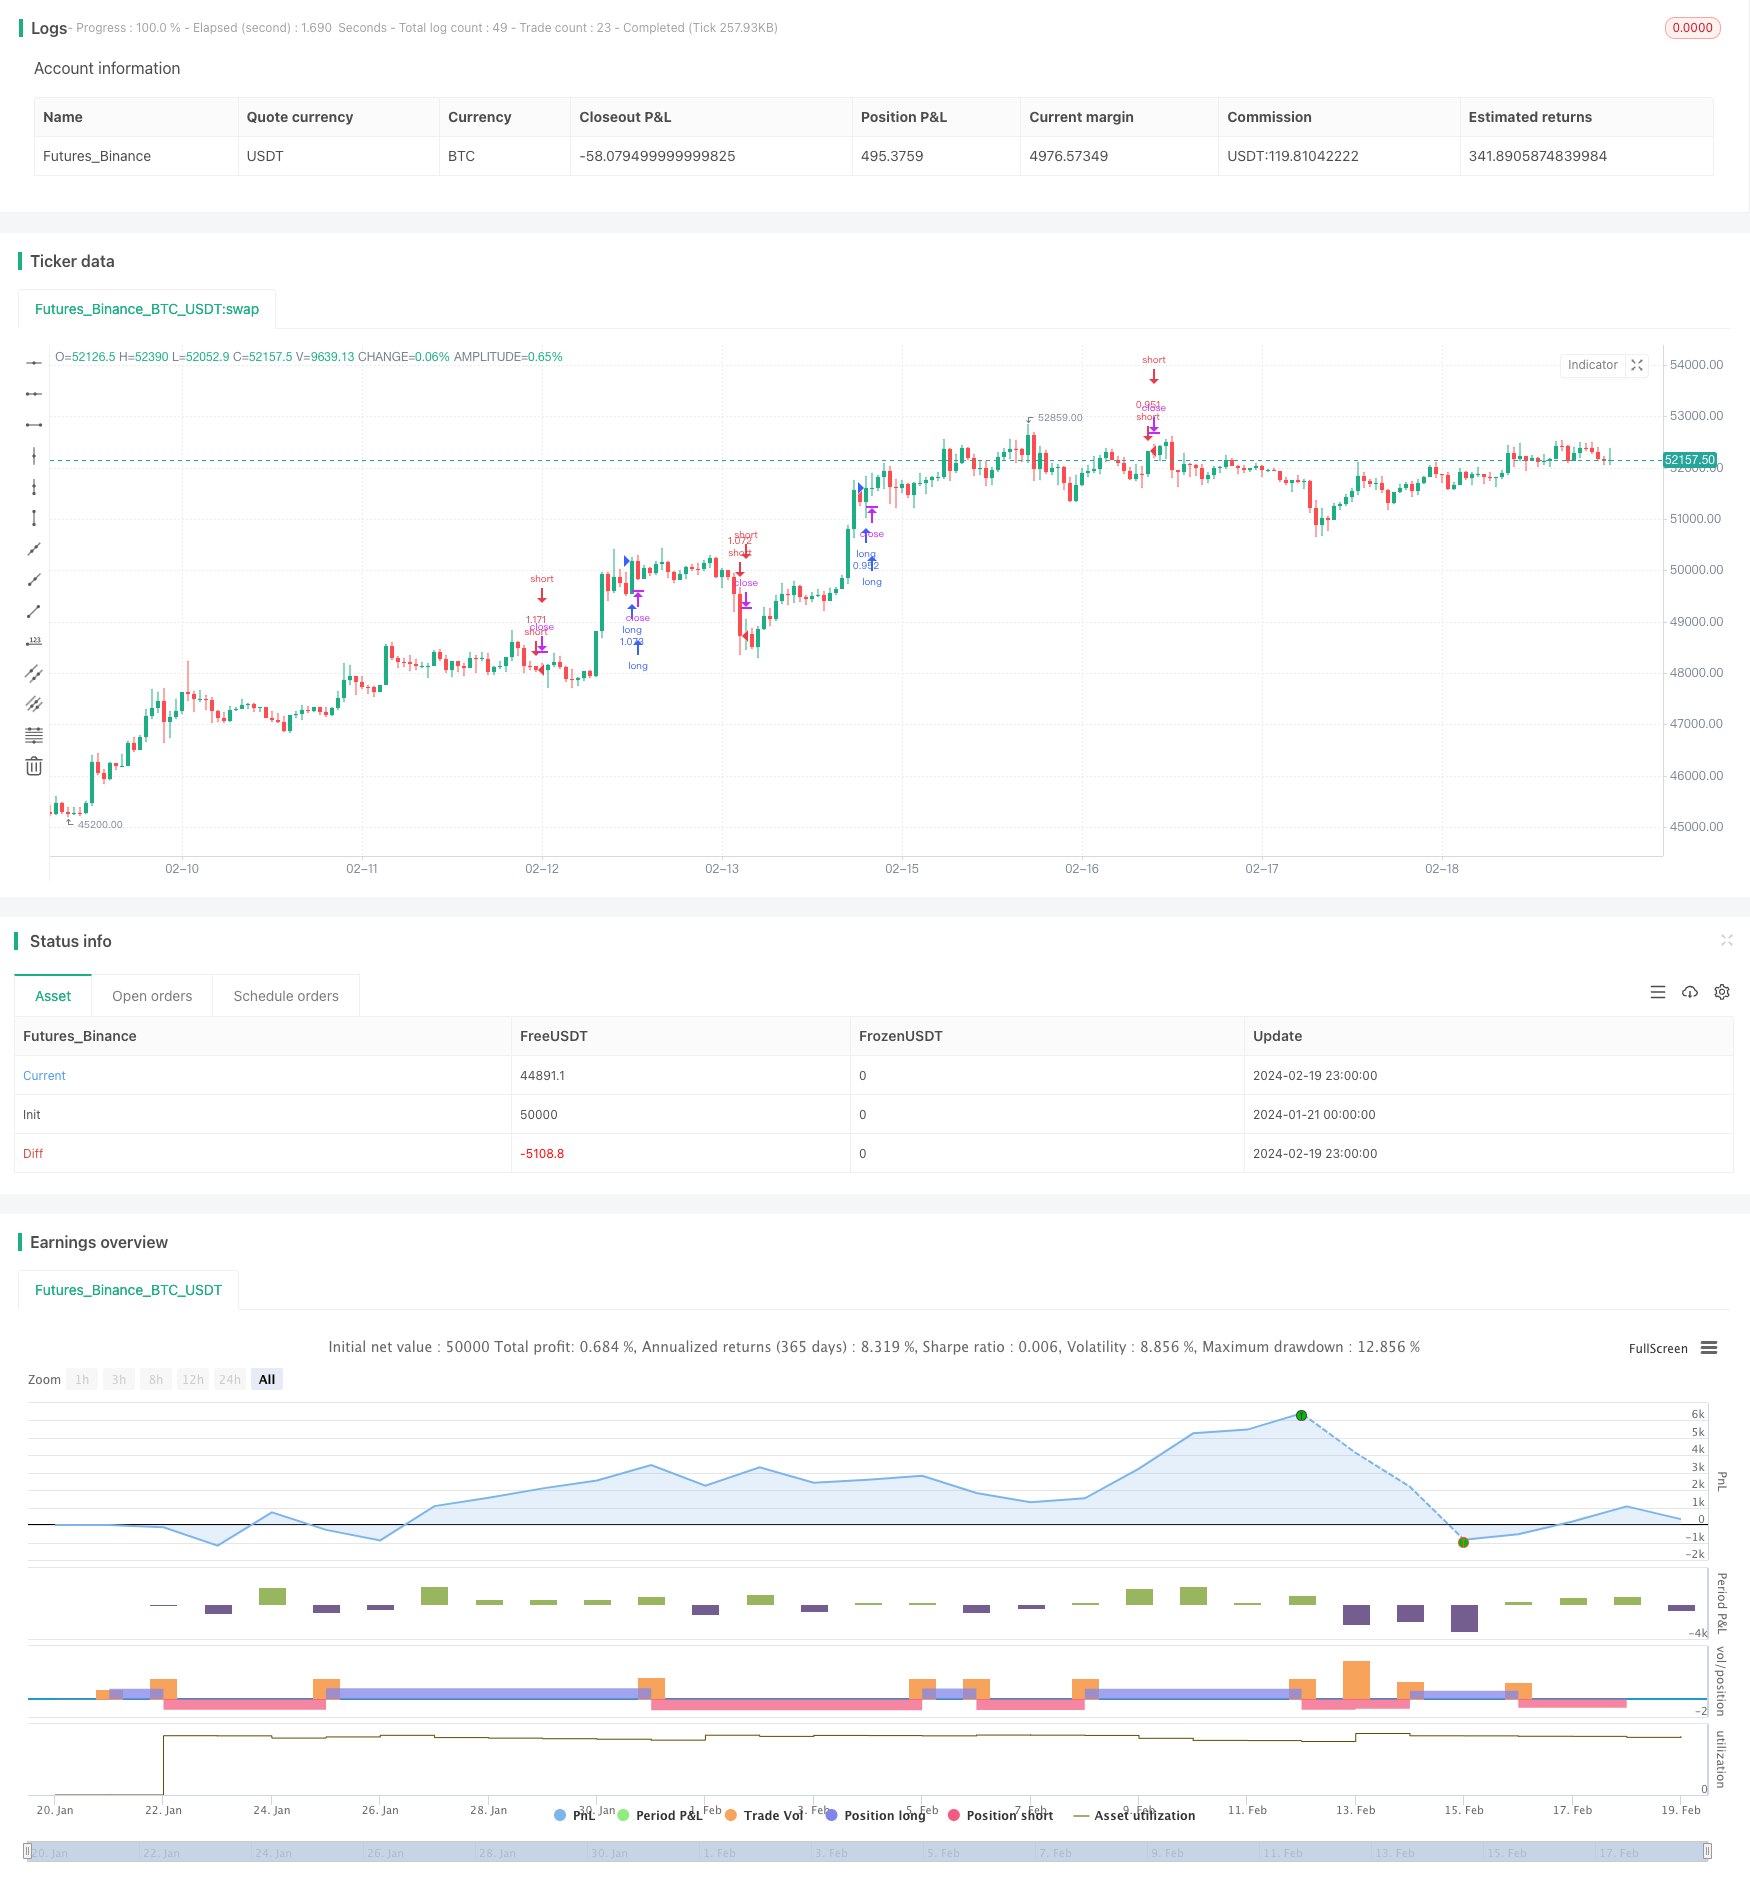
概述
该策略通过计算三组不同参数设置的 RSI 指数和对应的六条移动平均线,形成三条移动平均带,据此判断市场趋势方向,进行长线操作。
策略原理
- 计算三组 RSI 指数:RSI 快线 Period=50,RSI 中线 Period=75,RSI 慢线 Period=100。
- 对每组 RSI 指数分别计算 5、30、50、70、90、100 周期的简单移动平均线或指数移动平均线,形成移动平均带。
- 当快线 RSI 对应移动平均线全线上涨时判断为多头信号;当快线 RSI 对应移动平均线全线下跌时判断为空头信号。
- 中线 RSI 和慢线 RSI 对应移动平均带给出的交易信号亦然。
- 在给定的交易时间段内,当出现买入信号时按 100% 仓位多头开仓;当出现卖出信号时平掉之前的多头仓位。
优势分析
该策略结合 RSI 指标和移动平均线的优势,利用三组参数设置不同的 RSI 以捕捉不同级别周期的趋势变化,同时运用六条移动平均线过滤掉部分噪声,从而提高信号的可靠性。
相比单一 RSI 和移动平均线,该组合利用系统性方法形成判断依据,不依赖参数优化,运用科学严谨,实施简便,容易掌握。
风险分析
RSI 组合移动平均线策略依赖参数设置,如果参数设置不当,将可能产生错位信号。此外,快速行情的波动也可能触发错误信号。
为减少错误信号风险,应适当调整 RSI 周期参数,或调整移动平均线的周期数目,找到最佳参数组合。
优化方向
该策略可从以下几个方面进一步优化:
- 添加止损逻辑。现有策略没有设置止损,容易受行情剧烈波动的影响。
- 优化参数设置。可以测试更多组合来寻找最佳参数。
- 增加其他指标过滤。可以引入 MACD、布林带等其他指标来确认信号。
- 加入时间和交易量过滤。避免异常时间段和量能的假信号。
总结
该三重 RSI 移动平均带策略整合多个指标的优势,通过严密的逻辑判断形成交易信号,对长线趋势进行判断。策略简单实用,容易掌握,适合移动平均带交易策略的学习和实践。随着参数和组合的不断优化,策略效果有望进一步改善。
策略源码
/*backtest
start: 2024-01-21 00:00:00
end: 2024-02-20 00:00:00
period: 1h
basePeriod: 15m
exchanges: [{"eid":"Futures_Binance","currency":"BTC_USDT"}]
*/

// This source code is subject to the terms of the Mozilla Public License 2.0 at https://mozilla.org/MPL/2.0/
// © exlux99

//@version=4

strategy(title="3 RSI MA movement crypto strategy", overlay=true, initial_capital = 100, default_qty_type=strategy.percent_of_equity, default_qty_value=100, commission_type=strategy.commission.percent, commission_value=0.03, pyramiding=1  )

///////////////
fromDay = input(defval = 1, title = "From Day", minval = 1, maxval = 31)
fromMonth = input(defval = 1, title = "From Month", minval = 1, maxval = 12)
fromYear = input(defval = 2019, title = "From Year", minval = 1970)
 //monday and session
// To Date Inputs
toDay = input(defval = 31, title = "To Day", minval = 1, maxval = 31)
toMonth = input(defval = 12, title = "To Month", minval = 1, maxval = 12)
toYear = input(defval = 2021, title = "To Year", minval = 1970)

startDate = timestamp(fromYear, fromMonth, fromDay, 00, 00)
finishDate = timestamp(toYear, toMonth, toDay, 00, 00)
time_cond = true

source = input(ohlc4)

RSIFast  = rsi(source, 50)
RSINorm  = rsi(source, 75)
RSISlow = rsi(source, 100)

// plot(RSIFast, color=color.silver, style=plot.style_area, histbase=50)
// plot(RSINorm, color=#98b8be, style=plot.style_area, histbase=50)
// plot(RSISlow, color=#be9e98, style=plot.style_area, histbase=50)

// plot(RSIFast, color=color.gray, style=plot.style_line, linewidth=1)
// plot(RSINorm, color=color.purple, style=plot.style_line, linewidth=2)
// plot(RSISlow, color=color.black, style=plot.style_line, linewidth=3)

exponential = false//input(false, title="Exponential MA")

src = (RSIFast)

ma05 = exponential ? ema(src, 05) : sma(src, 05)
ma30 = exponential ? ema(src, 30) : sma(src, 30)
ma50 = exponential ? ema(src, 50) : sma(src, 50)
ma70 = exponential ? ema(src, 70) : sma(src, 70)
ma90 = exponential ? ema(src, 90) : sma(src, 90)
ma100 = exponential ? ema(src, 100) : sma(src, 100)

leadMAColor = change(ma30)>=0 and ma30>ma100 ? color.lime            : change(ma30)<0  and ma30>ma100 ? color.red            : change(ma30)<=0 and ma30<ma100 ? color.maroon            : change(ma30)>=0 and ma30<ma100 ? color.green            : color.gray
maColor(ma, maRef) =>
              change(ma)>=0 and ma30>maRef ? color.lime            : change(ma)<0  and ma30>maRef ? color.red            : change(ma)<=0 and ma30<maRef ? color.maroon            : change(ma)>=0 and ma30<maRef ? color.green            : color.gray

// plot( ma30, color=maColor(ma30,ma100), style=plot.style_line, title="MMA30", linewidth=2)
// plot( ma50, color=maColor(ma50,ma100), style=plot.style_line, title="MMA50", linewidth=2)
// plot( ma70, color=maColor(ma70,ma100), style=plot.style_line, title="MMA70", linewidth=2)
// plot( ma90, color=maColor(ma90,ma100), style=plot.style_line, title="MMA90", linewidth=2)

long0=(leadMAColor==color.lime and maColor(ma30,ma100)==color.lime and maColor(ma50,ma100)==color.lime and maColor(ma70,ma100)==color.lime and maColor(ma90,ma100)==color.lime ) or (leadMAColor==color.green and maColor(ma30,ma100)==color.green and maColor(ma50,ma100)==color.green and maColor(ma70,ma100)==color.green and maColor(ma90,ma100)==color.green )
exit0=leadMAColor==color.maroon and maColor(ma30,ma100)==color.maroon and maColor(ma50,ma100)==color.maroon and maColor(ma70,ma100)==color.maroon and maColor(ma90,ma100)==color.maroon


exponential1 = false//input(false, title="Exponential MA")

src1 = (RSINorm)

ma051 = exponential1 ? ema(src1, 05) : sma(src1, 05)
ma301 = exponential1 ? ema(src1, 30) : sma(src1, 30)
ma501 = exponential1 ? ema(src1, 50) : sma(src1, 50)
ma701 = exponential1 ? ema(src1, 70) : sma(src1, 70)
ma901 = exponential1 ? ema(src1, 90) : sma(src1, 90)
ma1001 = exponential1 ? ema(src1, 100) : sma(src1, 100)

leadMAColor1 = change(ma051)>=0 and ma051>ma1001 ? color.lime            : change(ma051)<0  and ma051>ma1001 ? color.red            : change(ma051)<=0 and ma051<ma1001 ? color.maroon            : change(ma051)>=0 and ma051<ma1001 ? color.green            : color.gray
maColor1(ma, maRef) =>
              change(ma)>=0 and ma05>maRef ? color.lime            : change(ma)<0  and ma05>maRef ? color.red            : change(ma)<=0 and ma05<maRef ? color.maroon            : change(ma)>=0 and ma05<maRef ? color.green            : color.gray

// plot( ma051, color=leadMAColor1, style=plot.style_line, title="MMA05", linewidth=1)
// plot( ma301, color=maColor1(ma301,ma1001), style=plot.style_line, title="MMA30", linewidth=3)
// plot( ma501, color=maColor1(ma501,ma1001), style=plot.style_line, title="MMA50", linewidth=3)
// plot( ma701, color=maColor1(ma701,ma1001), style=plot.style_line, title="MMA70", linewidth=3)
// plot( ma901, color=maColor1(ma901,ma1001), style=plot.style_line, title="MMA90", linewidth=3)

long1=(leadMAColor1==color.lime and maColor1(ma301,ma1001)==color.lime and maColor1(ma501,ma1001)==color.lime and maColor1(ma701,ma1001)==color.lime and maColor1(ma901,ma1001)==color.lime ) or (leadMAColor1==color.green and maColor1(ma301,ma1001)==color.green and maColor1(ma501,ma1001)==color.green and maColor1(ma701,ma1001)==color.green and maColor1(ma901,ma100)==color.green )
exit1=leadMAColor1==color.maroon and maColor1(ma301,ma1001)==color.maroon and maColor1(ma501,ma1001)==color.maroon and maColor1(ma701,ma1001)==color.maroon and maColor1(ma901,ma1001)==color.maroon


exponential2 = false//input(false, title="Exponential MA")

src2 = (RSISlow)

ma052 = exponential2 ? ema(src2, 05) : sma(src2, 05)
ma302 = exponential2 ? ema(src2, 30) : sma(src2, 30)
ma502 = exponential2 ? ema(src2, 50) : sma(src2, 50)
ma702 = exponential2 ? ema(src2, 70) : sma(src2, 70)
ma902 = exponential2 ? ema(src2, 90) : sma(src2, 90)
ma1002 = exponential2 ? ema(src2, 100) : sma(src2, 100)

leadMAColor2 = change(ma052)>=0 and ma052>ma1002 ? color.lime            : change(ma052)<0  and ma052>ma1002 ? color.red            : change(ma052)<=0 and ma052<ma1002 ? color.maroon            : change(ma052)>=0 and ma052<ma1002 ? color.green            : color.gray
maColor2(ma, maRef) =>
              change(ma)>=0 and ma05>maRef ? color.lime            : change(ma)<0  and ma05>maRef ? color.red            : change(ma)<=0 and ma05<maRef ? color.maroon            : change(ma)>=0 and ma05<maRef ? color.green            : color.gray

// plot( ma052, color=leadMAColor2, style=plot.style_line, title="MMA05", linewidth=1)
// plot( ma302, color=maColor2(ma302,ma1001), style=plot.style_line, title="MMA30", linewidth=4)
// plot( ma502, color=maColor2(ma502,ma1001), style=plot.style_line, title="MMA50", linewidth=4)
// plot( ma702, color=maColor2(ma701,ma1001), style=plot.style_line, title="MMA70", linewidth=4)
// plot( ma902, color=maColor2(ma901,ma1001), style=plot.style_line, title="MMA90", linewidth=4)

long2=(leadMAColor2==color.lime and maColor2(ma302,ma1002)==color.lime and maColor2(ma502,ma1002)==color.lime and maColor2(ma702,ma1002)==color.lime and maColor2(ma902,ma1002)==color.lime ) or (leadMAColor2==color.green and maColor2(ma302,ma1002)==color.green and maColor2(ma502,ma1002)==color.green and maColor2(ma701,ma1002)==color.green and maColor2(ma901,ma1002)==color.green )
exit2=leadMAColor2==color.maroon and maColor2(ma302,ma1002)==color.maroon and maColor2(ma502,ma1002)==color.maroon and maColor2(ma702,ma1002)==color.maroon and maColor2(ma902,ma1002)==color.maroon


long= long1 or long2
exit=  exit1 or exit2


// ------------------------- Strategy Logic --------------------------------- //
var longOpened = false
var shortOpened = false
var int timeOfBuy = na


longConditionLongOnly= long and not longOpened

if longConditionLongOnly
    longOpened := true
    timeOfBuy := time


longExitSignal = exit
exitLongConditionLongOnly = longOpened[1] and longExitSignal

if exitLongConditionLongOnly
    longOpened := false
    timeOfBuy := na


//plotshape(longConditionLongOnly, color=color.green, text= "Buy", location= location.belowbar,style= shape.labelup, textcolor=color.white, size = size.tiny, title="Buy Alert",editable=false, transp=60)
//plotshape(exitLongConditionLongOnly, color=color.red, text= "exit", location= location.abovebar,style= shape.labeldown, textcolor=color.white, size = size.tiny, title="Sell Alert", editable=false, transp=60)

//alertcondition(longConditionLongOnly ,title='Buy Alert', message='Buy Alert')
//alertcondition(exitLongConditionLongOnly , title='exit Alert', message='exit Alert')

if(time_cond)
    strategy.entry("long",1,when=longConditionLongOnly)
    strategy.entry("short",0,when=exitLongConditionLongOnly)