概述
该策略的主要思想是在长期趋势方向上交易短期回撤。具体来说,使用200日简单移动均线判断长期趋势方向,使用10日简单移动均线判断短期趋势方向。当价格高于200日线时为多头市场,当价格低于200日线时为空头市场。在多头市场中,当价格下跌到10日线时,做多;在空头市场中,当价格上涨到10日线时,做空。
策略原理
该策略使用200日简单移动均线和10日简单移动均线判断市场趋势。当价格上穿200日线时认为进入多头市场,当价格下穿200日线时认为进入空头市场。在多头市场中,如果价格下跌到10日线附近,说明遇到了短期调整,这时做多,目标是追随长期多头趋势的继续上涨。在空头市场中,如果价格上涨到10日线附近,说明遇到了短期反弹,这时做空,目标是追随长期空头趋势的继续下跌。
具体来说,当满足以下条件时,做多进入场内:价格高于200日线,价格低于10日线,此前没有持仓。当满足以下条件时,平仓退出场内:价格高于10日线,此前持有多头仓位。为了防止巨大亏损,设置了FAILSAFE止损,如果从最高点回撤幅度超过10%,直接止损退出。
可以看出,该策略的交易逻辑主要基于均线的金叉死叉,在长短均线判断后的趋势方向上进行回撤买入和趋势追踪止盈,属于典型的趋势跟踪策略。
优势分析
该策略最大的优势在于以低资金成本进行趋势跟踪,追求超额收益。具体优势如下:
使用长短期均线组合判断主次级别的趋势方向,可以有效锁定中长线趋势机会,避免被短期行情误导。
采用短期回撤切入的方式,可以最大限度地降低买入成本,从而获得较高的盈利空间。
设置FAILSAFE止损机制,可以有效控制单笔亏损,保护账户资金安全。
允许追踪止盈退出,充分挖掘中长线趋势机会,获得超额Alpha。
采用纯机械化交易方式,避免主观情绪影响,使策略更易于实施。
风险分析
该策略主要存在以下风险:
回测数据拟合风险。实际市场条件可能与历史数据存在差异,从而导致实盘交易效果打折。
假突破风险。价格仅触及均线附近就反转回调的概率较大,容易造成小额亏损累积。
趋势反转风险。中长线趋势突然反转是常见情况,这时持仓容易造成较大亏损。
对策如下:
增加样本量,使用更多历史数据进行稳健性验证,确保结果可靠。
优化参数,调整均线系统参数组合,确保交易信号质量。
适当放宽止损线,给予价格一定回调空间,避免过于敏感止损。
优化方向
该策略可以从以下方面进行进一步优化:
增加过滤条件,如交易量过滤,可以有效减少假突破引发的不必要交易。
结合其他指标,如KDJ、MACD等,形成指标组合,可以提高交易信号的质量。
测试不同持仓时间,优化止盈和止损策略,进一步提高夏普率等指标。
根据市场情况动态调整参数,形成自适应参数优化机制,使策略更具鲁棒性。
增加算法交易模块,利用机器学习等方法自动生成交易信号,减少人为干预。
总结
本策略整体思路清晰、易于实现,以低成本追踪中长线趋势,可以获得稳定的Alpha。但也存在一定概率被套利的风险,需要进一步优化以提高稳定性。总的来说,本策略从趋势跟踪的角度进行设计,值得进一步研究与应用。如果参数调整得当,应能获得良好的实盘效果。
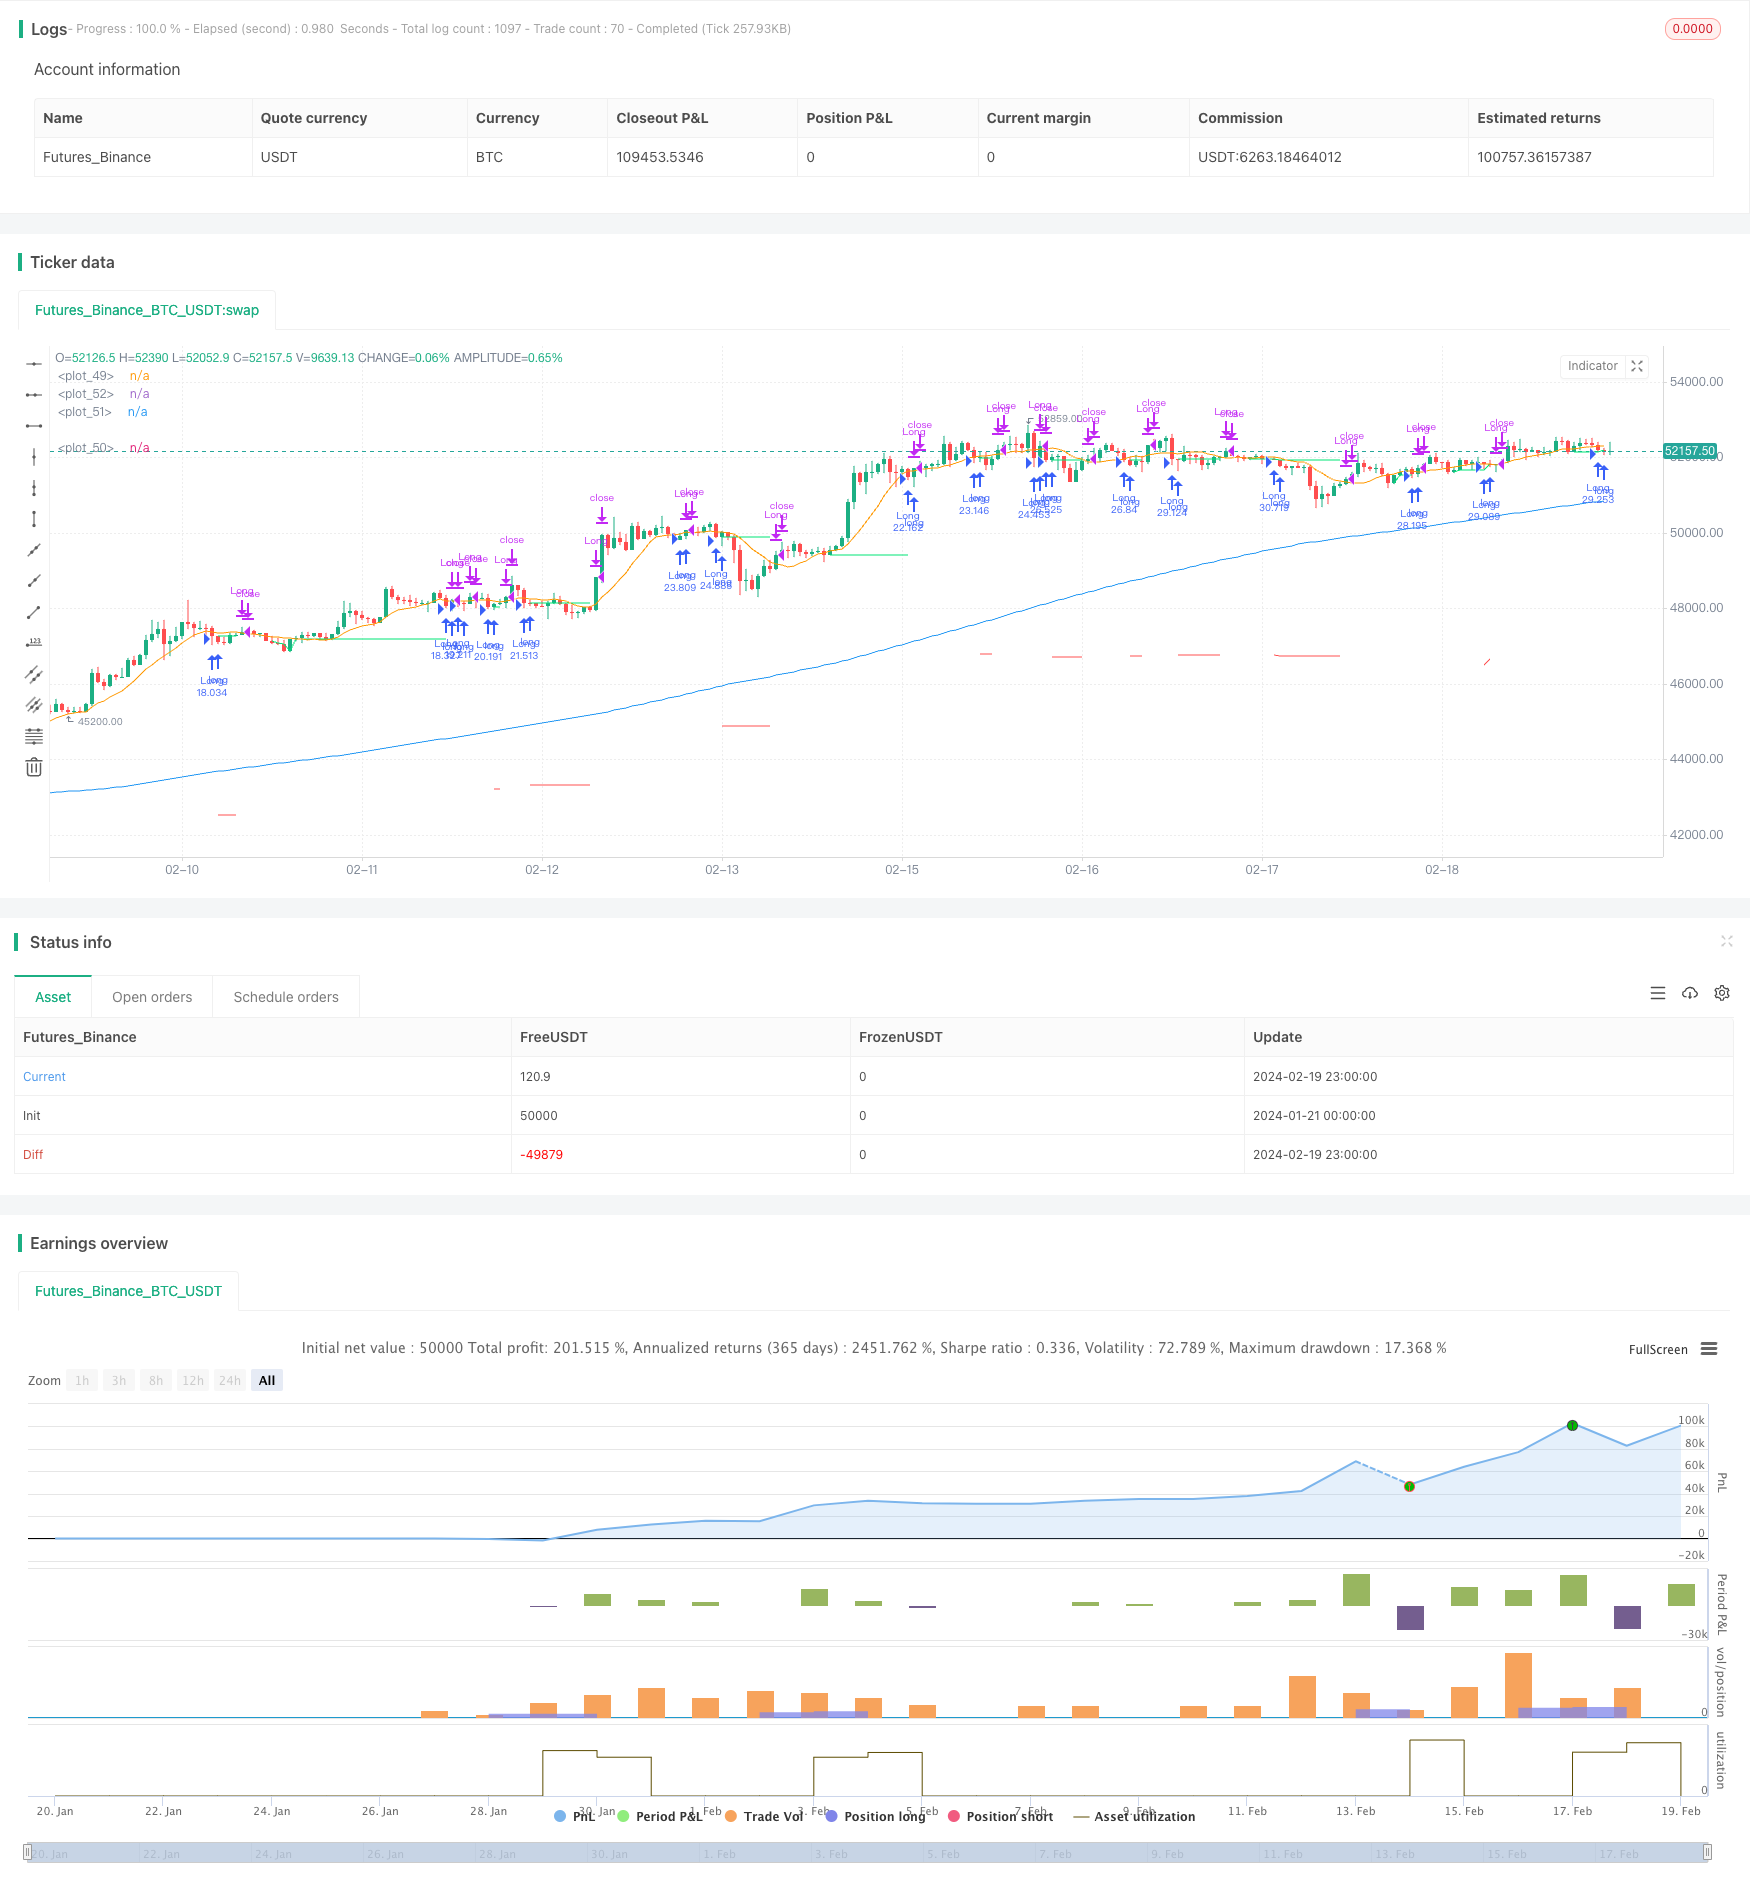
/*backtest
start: 2024-01-21 00:00:00
end: 2024-02-20 00:00:00
period: 1h
basePeriod: 15m
exchanges: [{"eid":"Futures_Binance","currency":"BTC_USDT"}]
*/

// This Pine Script™ code is subject to the terms of the Mozilla Public License 2.0 at https://mozilla.org/MPL/2.0/
// © irfanp056
// @version=5

strategy("Simple Pullback Strategy",
     overlay=true,
     initial_capital=100000,
     default_qty_type=strategy.percent_of_equity,
     default_qty_value=1000, // 100% of balance invested on each trade
     commission_type=strategy.commission.cash_per_contract,
     commission_value=0.005) // Interactive Brokers rate

// Get user input
i_ma1           = input.int(title="MA 1 Length", defval=200, step=10, group="Strategy Parameters", tooltip="Long-term MA")
i_ma2           = input.int(title="MA 2 Length", defval=10, step=10, group="Strategy Parameters", tooltip="Short-term MA")
i_stopPercent   = input.float(title="Stop Loss Percent", defval=0.10, step=0.1, group="Strategy Parameters", tooltip="Failsafe Stop Loss Percent Decline")
i_lowerClose    = input.bool(title="Exit On Lower Close", defval=false, group="Strategy Parameters", tooltip="Wait for a lower-close before exiting above MA2")
i_startTime     = input(title="Start Filter", defval=timestamp("01 Jan 1995 13:30 +0000"), group="Time Filter", tooltip="Start date & time to begin searching for setups")
i_endTime       = input(title="End Filter", defval=timestamp("1 Jan 2099 19:30 +0000"), group="Time Filter", tooltip="End date & time to stop searching for setups")

// Get indicator values
ma1 = ta.sma(close, i_ma1)
ma2 = ta.sma(close, i_ma2)

// Check filter(s)
f_dateFilter = true

// Check buy/sell conditions
var float buyPrice = 0
buyCondition    = close > ma1 and close < ma2 and strategy.position_size == 0 and f_dateFilter
sellCondition   = close > ma2 and strategy.position_size > 0 and (not i_lowerClose or close < low[1])
stopDistance    = strategy.position_size > 0 ? ((buyPrice - close) / close) : na
stopPrice       = strategy.position_size > 0 ? buyPrice - (buyPrice * i_stopPercent) : na
stopCondition   = strategy.position_size > 0 and stopDistance > i_stopPercent

// Enter positions
if buyCondition
    strategy.entry(id="Long", direction=strategy.long)

if buyCondition[1]
    buyPrice := open

// Exit positions
if sellCondition or stopCondition
    strategy.close(id="Long", comment="Exit" + (stopCondition ? "SL=true" : ""))
    buyPrice := na

// Draw pretty colors
plot(buyPrice, color=color.lime, style=plot.style_linebr)
plot(stopPrice, color=color.red, style=plot.style_linebr, offset=-1)
plot(ma1, color=color.blue)
plot(ma2, color=color.orange)