概述
宽带震荡锁定策略是一种基于布林带指标判断市场波动性是否降低的长线突破策略。当市场进入震荡整理阶段时,布林带上下轨会发生收敛,此时我们判断为机会进入场内。我们同时结合平均真实波动范围指标来确认价格波动性的降低。
策略原理
该策略主要依赖布林带指标判断价格是否进入低波动的震荡期。布林带中轨线为收盘价的移动平均线,上下轨分别为中轨向上下各偏移两个标准差。当价格波动性降低时,上下轨间距会发生明显的收窄。我们初步判断布林带是否发生收敛时,会检测当前的ATR值是否小于布林带上下轨间的标准差。这表示价格刚刚进入震荡整理的状态。
为了进一步证实波动性的下降,我们检测ATR值的移动平均线是否出现下降趋势。平均ATR的值下降也从侧面佐证了波动性正在降低。当上述两个条件同时满足时,我们判定布林带已经出现明显的收敛,这是个绝佳的买入时机。
我们在买入后,会启用以ATR值的两倍作为止损距离的移动止损策略。这可以有效控制损失。
优势分析
该策略最大的优势是能准确判断市场进入低波动的震荡整理期,从而确定最佳的买入时机。相比于其他长线策略,宽带震荡锁定策略的获利机率更高。
其次,该策略还运用了移动止损来主动控制风险。这使得即使行情不利也能最大程度减少损失。这是很多长线策略所欠缺的。
风险分析
策略的主要风险在于布林带指标并不能百分之百准确判断价格波动性的变化。当布林带误判波动性降低时,我们买入的时机可能会不利。此时移动止损就发挥重要作用,可以尽早止损退出。
另外,策略中各种参数的设置也会对结果产生影响。我们需要通过大量回测优化参数,使策略更加稳健。
优化方向
我们可以考虑在布林带收敛的同时,增加其他指标来确认趋势性指标也出现转折迹象。例如在布林带收敛时,同时要求MACD差值已由正转负,或RSI已由超买区下探等。这可以进一步提高买入时机的准确性。
另一方向是测试不同参数对结果的影响,如布林带周期、ATR周期和移动止损倍数等的设置。我们需要使用步进优化来找到最优参数组合。
总结
宽带震荡锁定策略利用布林带指标判断价格波动性降低的时机,运用移动止损有效控制风险,是一种相对稳定的长线突破策略。我们仍需要进一步优化参数和组合其他指标来提升策略的稳健性。
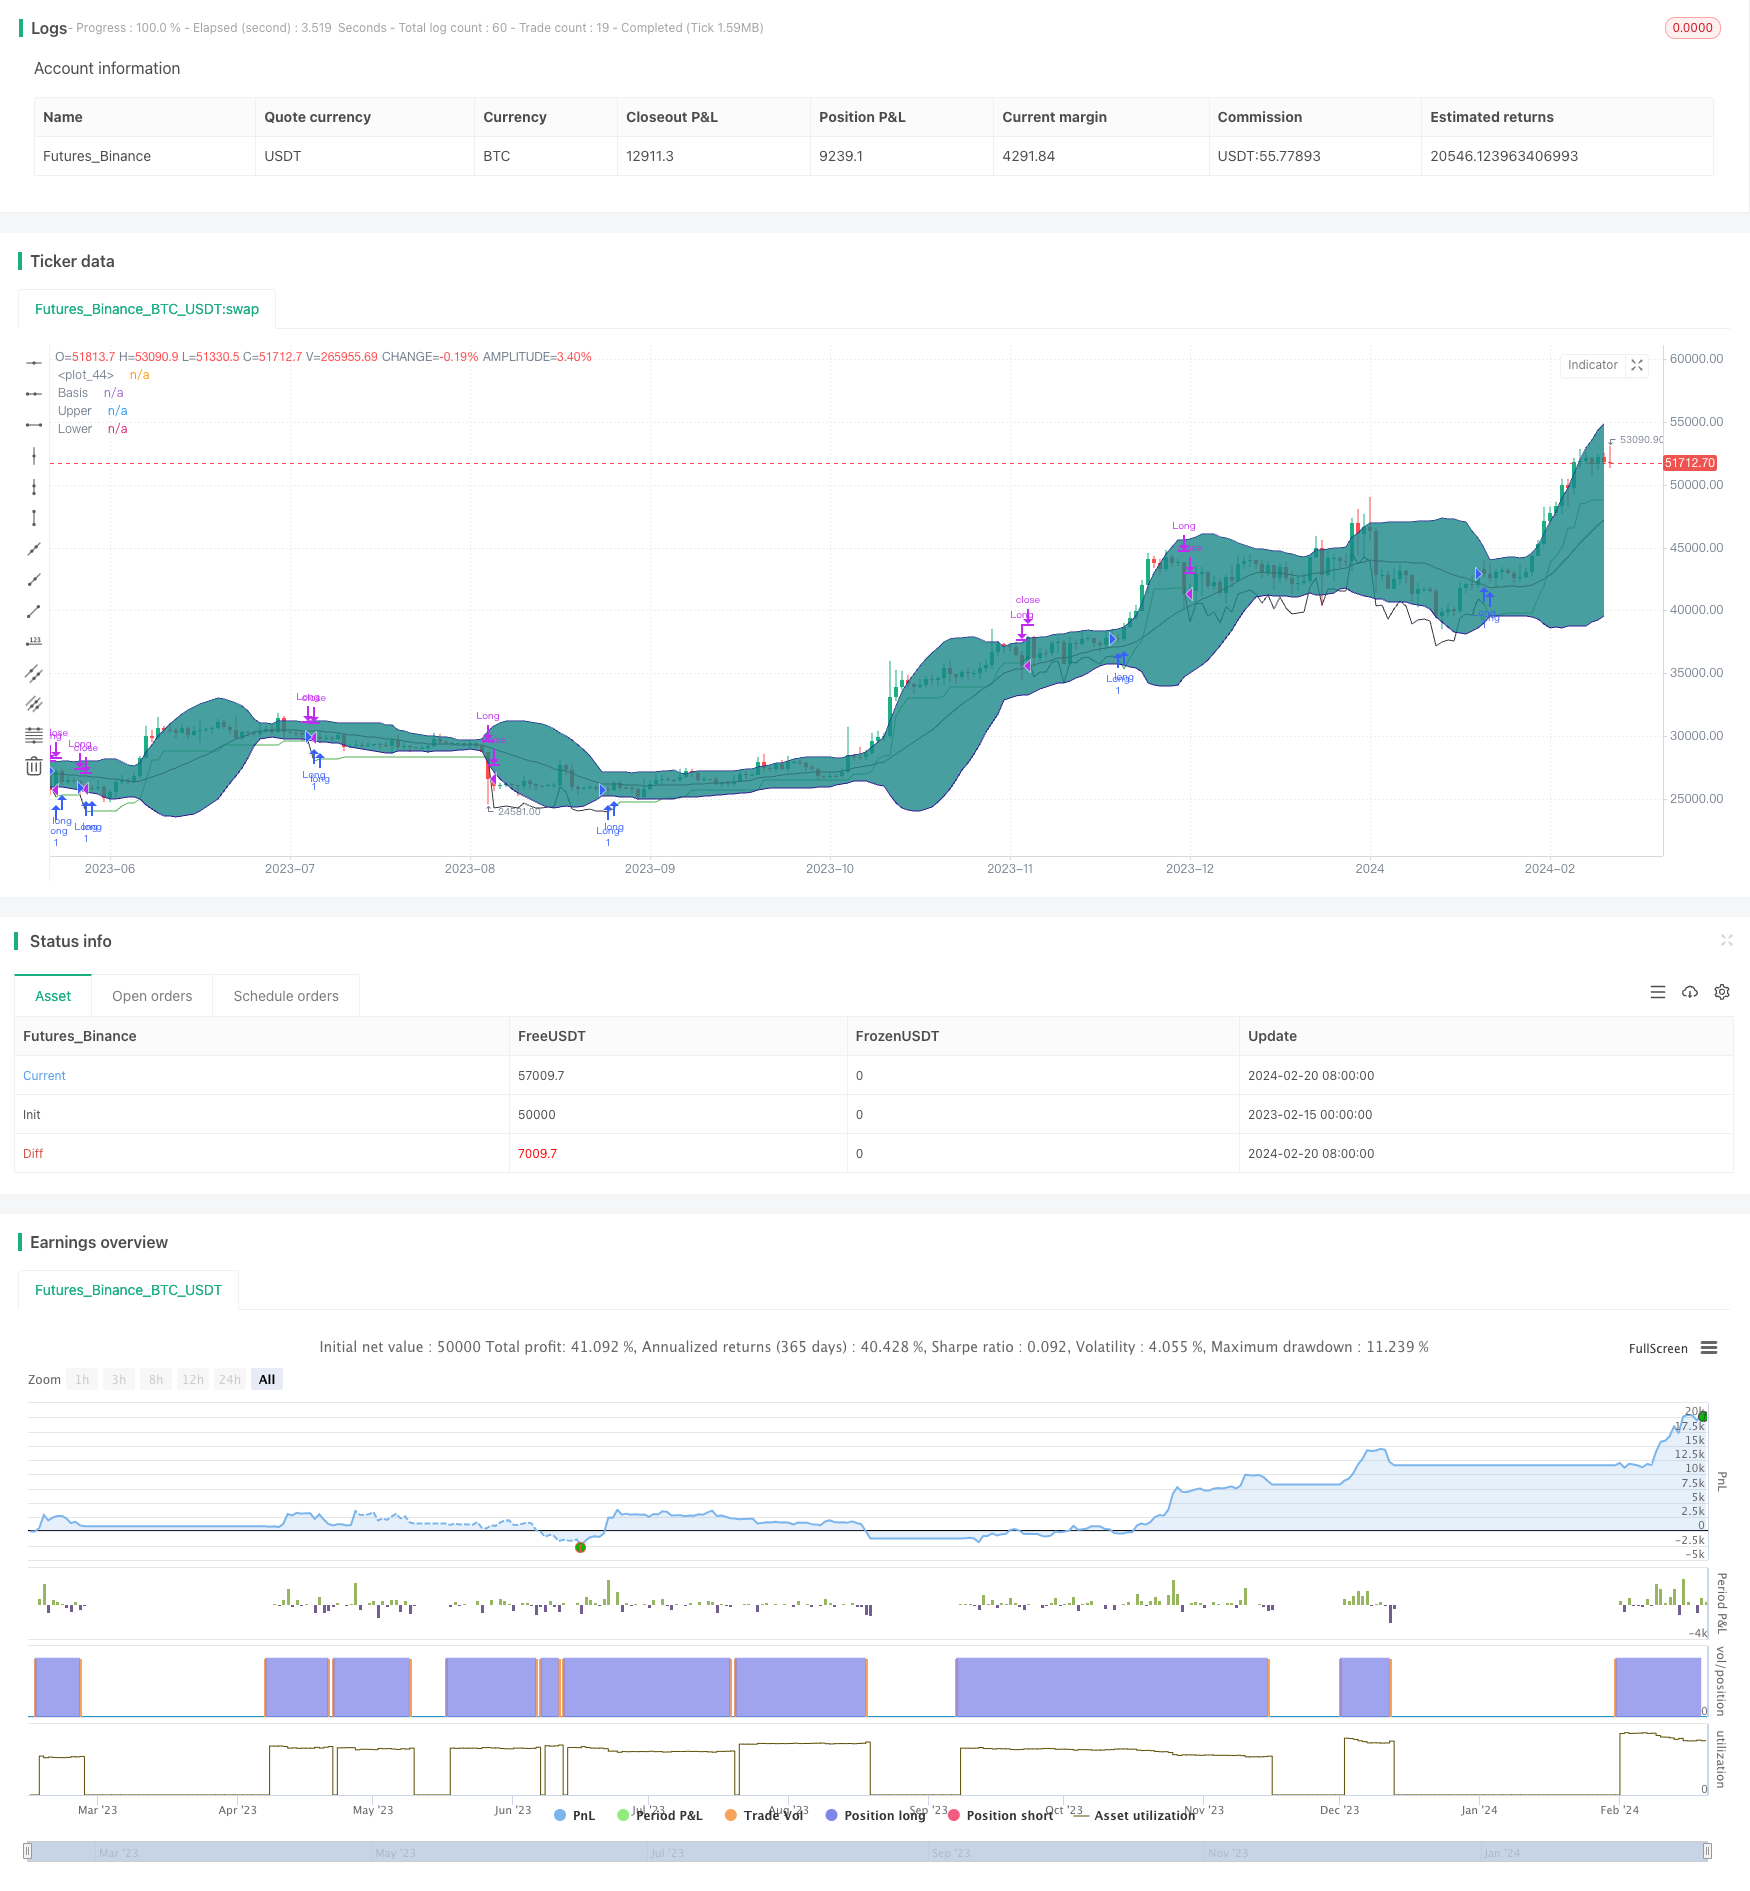
/*backtest
start: 2023-02-15 00:00:00
end: 2024-02-21 00:00:00
period: 1d
basePeriod: 1h
exchanges: [{"eid":"Futures_Binance","currency":"BTC_USDT"}]
*/

// This source code is subject to the terms of the Mozilla Public License 2.0 at https://mozilla.org/MPL/2.0/
// © DojiEmoji

//@version=4
strategy("[KL] Bollinger Bands Consolidation Strategy",overlay=true,pyramiding=1)

// Timeframe {
backtest_timeframe_start = input(defval = timestamp("01 Apr 2016 13:30 +0000"), title = "Backtest Start Time", type = input.time)
USE_ENDTIME = input(false,title="Define backtest end-time (If false, will test up to most recent candle)")
backtest_timeframe_end = input(defval = timestamp("19 Apr 2021 19:30 +0000"), title = "Backtest End Time (if checked above)", type = input.time)
within_timeframe = true
// }

// Indicator: BOLL bands {
BOLL_length = 20//input(20,title="Periods to lookback for BOLL and ATR calc. (default 20)")
BOLL_src = close
BOLL_center = sma(BOLL_src, BOLL_length)
BOLL_sDEV_x2 = 2 * stdev(BOLL_src, BOLL_length)
BOLL_upper = BOLL_center + BOLL_sDEV_x2
BOLL_lower = BOLL_center - BOLL_sDEV_x2
plot(BOLL_center, "Basis", color=#872323, offset = 0)
BOLL_p1 = plot(BOLL_upper, "Upper", color=color.navy, offset = 0, transp=50)
BOLL_p2 = plot(BOLL_lower, "Lower", color=color.navy, offset = 0, transp=50)
fill(BOLL_p1, BOLL_p2, title = "Background", color=#198787, transp=85)
// }
// ATR and volatility Indicator {
ATR_x2 = atr(BOLL_length) * 2 // multiplier aligns with BOLL
avg_volat = sma(ATR_x2, BOLL_length)
//}

// Trailing stop loss {
var entry_price = float(0)
var trailing_SL_buffer = float(0)
var stop_loss_price = float(0)
trail_profit_line_color = color.green
UPDATE_ATR_TSL = false
if strategy.position_size == 0 or not within_timeframe // make TSL line less visible
    trail_profit_line_color := color.black
    stop_loss_price := close - trailing_SL_buffer
else if strategy.position_size > 0
    if UPDATE_ATR_TSL and ATR_x2 < trailing_SL_buffer
        trailing_SL_buffer := ATR_x2
    stop_loss_price := max(stop_loss_price, close[1] - trailing_SL_buffer)
plot(stop_loss_price,color=trail_profit_line_color)
// }


IGNORE_BOLL_SHAPE = false//input(false,title="Ignore BOLL (vs ATR) during entry (experimental)")
IGNORE_VOLATILITY = false///input(false,title="Ignore average ATR during entry (experimental)")
// Main:
if within_timeframe
    // ENTRY:
    if (ATR_x2 > BOLL_sDEV_x2 or IGNORE_BOLL_SHAPE) and (avg_volat < avg_volat[1] or IGNORE_VOLATILITY)
        if strategy.position_size == 0
            entry_price := close
            trailing_SL_buffer := ATR_x2
            stop_loss_price := close - ATR_x2
            strategy.entry("Long",strategy.long, comment="enter")
        if strategy.position_size > 0
            strategy.entry("Long",strategy.long, comment="+")

    // EXIT:
    if strategy.position_size > 0
        if low <= stop_loss_price
            if close > entry_price
                strategy.close("Long", comment="take profit")
            else if low <= entry_price
                strategy.close("Long", comment="stop loss")

            if strategy.position_size == 0
                entry_price := 0