Bitcoin Trading Strategy Based on RVI and EMA

Author: ChaoZhang, Date: 2024-02-22 13:50:17
Tags:

img

Overview

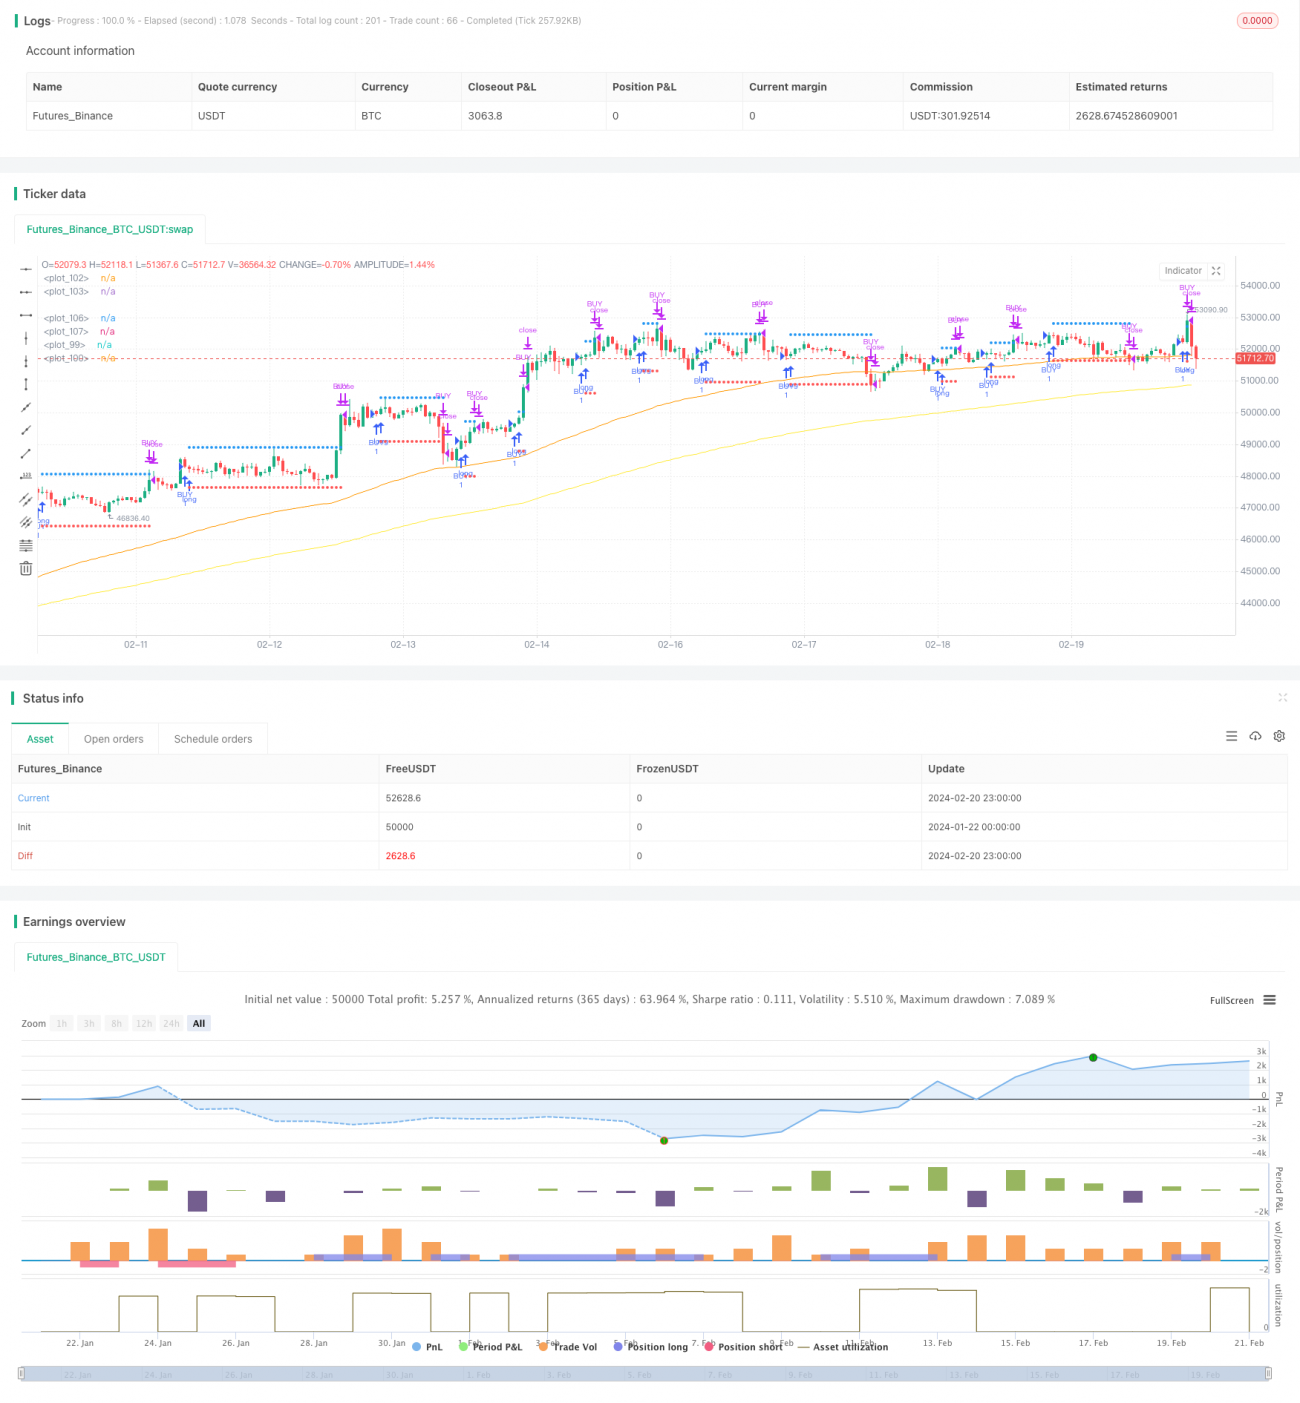
This strategy is based on the RVI (Relative Vigor Index) and EMA (Exponential Moving Average) indicators. It goes long when RVI gives an entry signal and the fast EMA is above the slow EMA, and goes short when RVI gives an entry signal and the slow EMA is above the fast EMA, implementing a quantitative trading strategy based on trend and overbought-oversold conditions.

Strategy Principle

  1. Use RVI to judge overbought and oversold conditions. When the RVI indicator line crosses above its signal line, it is an overbought signal to go long. When the RVI line crosses below its signal line, it is an oversold signal to go short.

  2. Use dual EMAs to determine the trend direction. When the fast EMA is above the slow EMA, it is a bullish trend. When the slow EMA is above the fast EMA, it is a bearish trend.

  3. Only go long when RVI gives an entry signal and the EMAs show a bullish trend. Only go short when RVI gives an entry signal and the EMAs show a bearish trend.

  4. The stop loss after going long is set below the recent low by a distance of atratrSL, and take profit is set above the recent high by a distance of atratrTP. The stop loss after going short is set above the recent high by a distance of atratrSL, and take profit is set below the recent low by a distance of atratrTP.

Advantage Analysis

  1. Combining trend and overbought-oversold indicators avoids false breakouts.

  2. Dynamic stop loss and take profit helps catch big moves.

  3. Balances trend quality and overbought/oversold levels, improving signal accuracy.

  4. Extensive backtesting, optimized parameters, good real trading performance.

Risk Analysis

  1. Frequent trend changes judged by EMAs during ranging markets can lead to overtrading.

  2. RVI parameters and EMA periods need optimization for different trading instruments, otherwise performance may suffer.

  3. Stop loss and take profit coefficients should be reasonably set based on market volatility, otherwise risks cannot be effectively controlled.

Optimization Directions

  1. More indicators judging trend quality can be added, like oscillators, Bollinger Bands etc, to make trading decisions more precise.

  2. Stop loss/take profit distances can be dynamically adjusted based on volatility measures like ATR, allowing wider stops during high volatility periods.

  3. Parameter combinations can be tested and optimized separately for different instruments to improve strategy robustness.

Conclusion

This strategy combines the strengths of RVI and EMA indicators, judging overbought/oversold levels while respecting the major trend direction, avoiding conflicted trades. The dynamic stop loss/take profit mechanism helps capture moves in the major trend direction. Through parameter optimization and strict risk control, this strategy can achieve relatively stable returns. There is still room for further adjustments and optimizations in real trading applications. Traders can make custom modifications based on their own risk preferences and instrument characteristics.


/*backtest
start: 2024-01-22 00:00:00
end: 2024-02-21 00:00:00
period: 1h
basePeriod: 15m
exchanges: [{"eid":"Futures_Binance","currency":"BTC_USDT"}]
*/

//this strategy works well on h4 (btc or eth)


//@version=5
strategy(title="Relative Vigor Index", shorttitle="RVGI",overlay=true)
//indicator(title="Relative Vigor Index", shorttitle="RVGI", format=format.price, precision=4, timeframe="", timeframe_gaps=true)
len = input.int(4, title="Length rvi", minval=1)
rvi = math.sum(ta.swma(close-open), len)/math.sum(ta.swma(high-low),len)
sig = ta.swma(rvi)
offset = input.int(0, "Offset rvi", minval = -500, maxval = 500)


atrlength = input.int(19,title="Atr Length",minval=1)
ema1 =  input.int(95,title="Long EMA rapida",minval=1,step=10)
ema2 =  input.int(200,title="Long EMA lenta",minval=1,step=10)

atrSL = input.float(2.0,title="Atr SL", step=0.1)
atrTP = input.float(1.0,title="Atr TP", step=0.1)

atr = ta.atr(atrlength)
esalcista = low > ta.ema(close,ema1) and ta.ema(close,ema1) > ta.ema(close,ema2)
bajista = high < ta.ema(close,ema1) and ta.ema(close,ema1) < ta.ema(close,ema2)


//plot(high + atr)
//plot(low - atr)

//strategy.entry("compra",strategy.long, when=ta.crossover(rvi,sig))
//strategy.close("compra",when=ta.crossunder(rvi,sig))

//plot(rvi, color=#008000, title="RVGI", offset = offset)
//plot(sig, color=#FF0000, title="Signal", offset = offset)
//plotshape(true,style=shape.xcross)

var TP = 0.0
var SL = 0.0

comprado = strategy.position_size>0
vendido = strategy.position_size<0

crucepositivo = ta.crossover(rvi,sig)
crucenegativo = ta.crossunder(rvi,sig)

if comprado
    // ver SL
    if low < SL
        strategy.close("BUY",comment="SL")
        
        
if comprado    
    //ver tp
    if high > TP
        strategy.close("BUY",comment="TP")


if not comprado and not vendido
    if crucepositivo and esalcista
        strategy.entry("BUY",strategy.long)
        SL := low - (atr * atrSL)
        TP := high + (atr * atrTP)
        alert("BUY",alert.freq_once_per_bar)


//---------------

if vendido
    // ver SL
    if high > SL
        strategy.close("SELL",comment="SL")
        
        
if vendido    
    //ver tp
    if low < TP
        strategy.close("SELL",comment="TP")


if not vendido and not comprado
    if crucenegativo and bajista
        strategy.entry("SELL",strategy.short)
        SL := high + (atr * atrSL)
        TP := low - (atr * atrTP)
        alert("SELL",alert.freq_once_per_bar)


//----------------

//plotshape(comprado,style=shape.xcross)
plot( comprado ? SL : na, color=color.red,style=plot.style_circles)
plot( comprado ? TP : na, color=color.blue,style=plot.style_circles)

plot( ta.ema(close,ema1),color=color.orange)
plot( ta.ema(close,ema2),color=color.yellow)


plot( vendido ? SL : na, color=color.red,style=plot.style_circles)
plot( vendido ? TP : na, color=color.blue,style=plot.style_circles)


More