Log Ichimoku Cross Variety Strategy

Overview
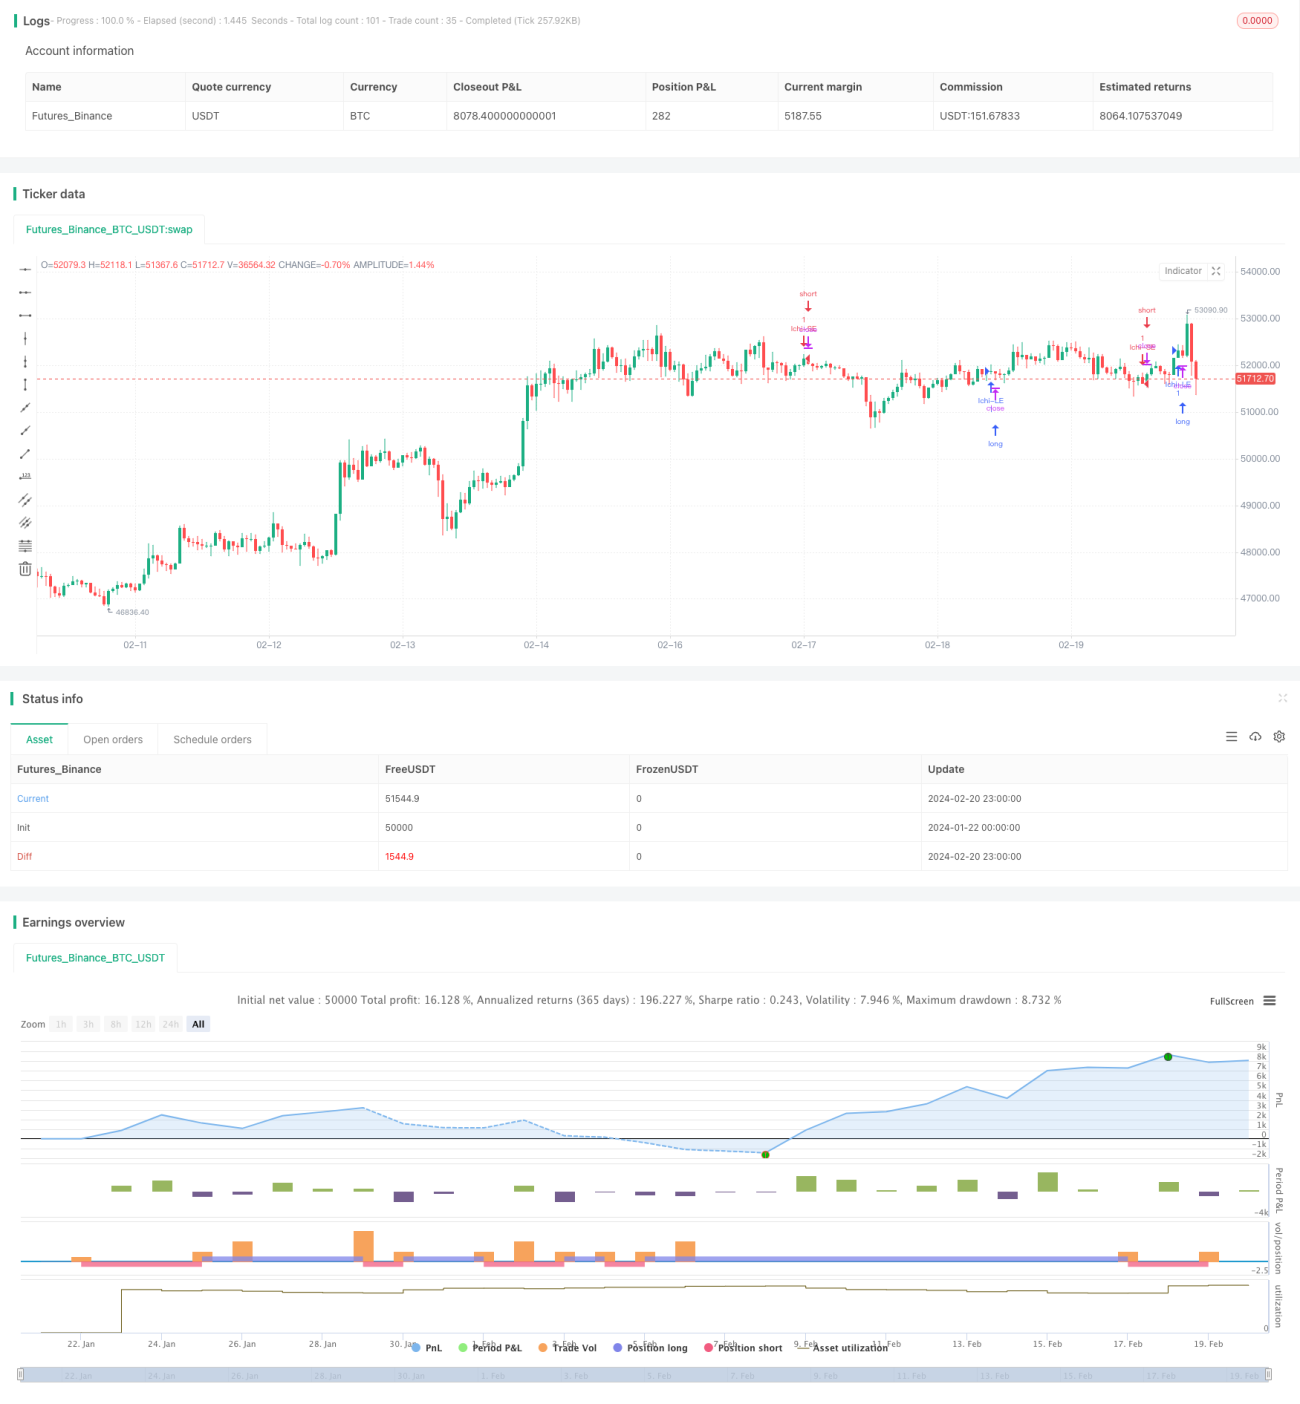
This strategy is a simple cryptocurrency trading strategy that uses log-scale Ichimoku clouds to generate trading signals. It is designed for cross-cryptocurrency trading between varieties.
Strategy Logic
The strategy uses a custom log-scale Ichimoku indicator as the primary trading indicator. The Ichimoku indicator usually contains the conversion line, base line and lagging span. In this strategy, these lines are calculated in logarithmic price space.
Specifically, the conversion line is the recent 9-period mean of the log lows and log highs. The base line is the 26-period mean of the same. Lead line 1 is the mean of the conversion and base lines. Lead line 2 is the 52-period lookback mean.
A long signal is generated when lead line 1 crosses over lead line 2. A short signal is generated on the cross under.
Advantage Analysis
The key advantage of this strategy is using the log-scale Ichimoku indicator better captures trend changes across cryptocurrencies. Percentage changes are more consistent in logarithmic space, resulting in more reliable trading signals.
Another advantage is that it facilitates cross-variety trading of cryptocurrencies. Using the log-Ichimoku improves comparability of price changes across different crypto varieties.
Risk Analysis
The main risk is that Ichimoku signals may fail. Particularly in volatile crypto markets, performance of Ichimoku can deteriorate.
Also, logarithmic transforms may fail during extreme moves. Comparability of logarithmic space decreases when prices make anomalous jumps.
Enhancement Opportunities
The strategy can be enhanced by:
-
Adding filters to confirm Ichimoku signals to reduce false signals
-
Updating optimal parameters more suited to crypto varieties
-
Adding pre-entry filters like volume to avoid false breakouts
-
Optimizing entry rules and adding stops and profit targets to control risk
Conclusion
This strategy utilizes the logarithmic Ichimoku indicator to design a quantitative strategy tailored to cryptocurrencies and cross-variety trading. While advantageous for capturing trends, it has risks. Further optimizations to parameters, filters and risk controls can enhance strategy performance.
- 1