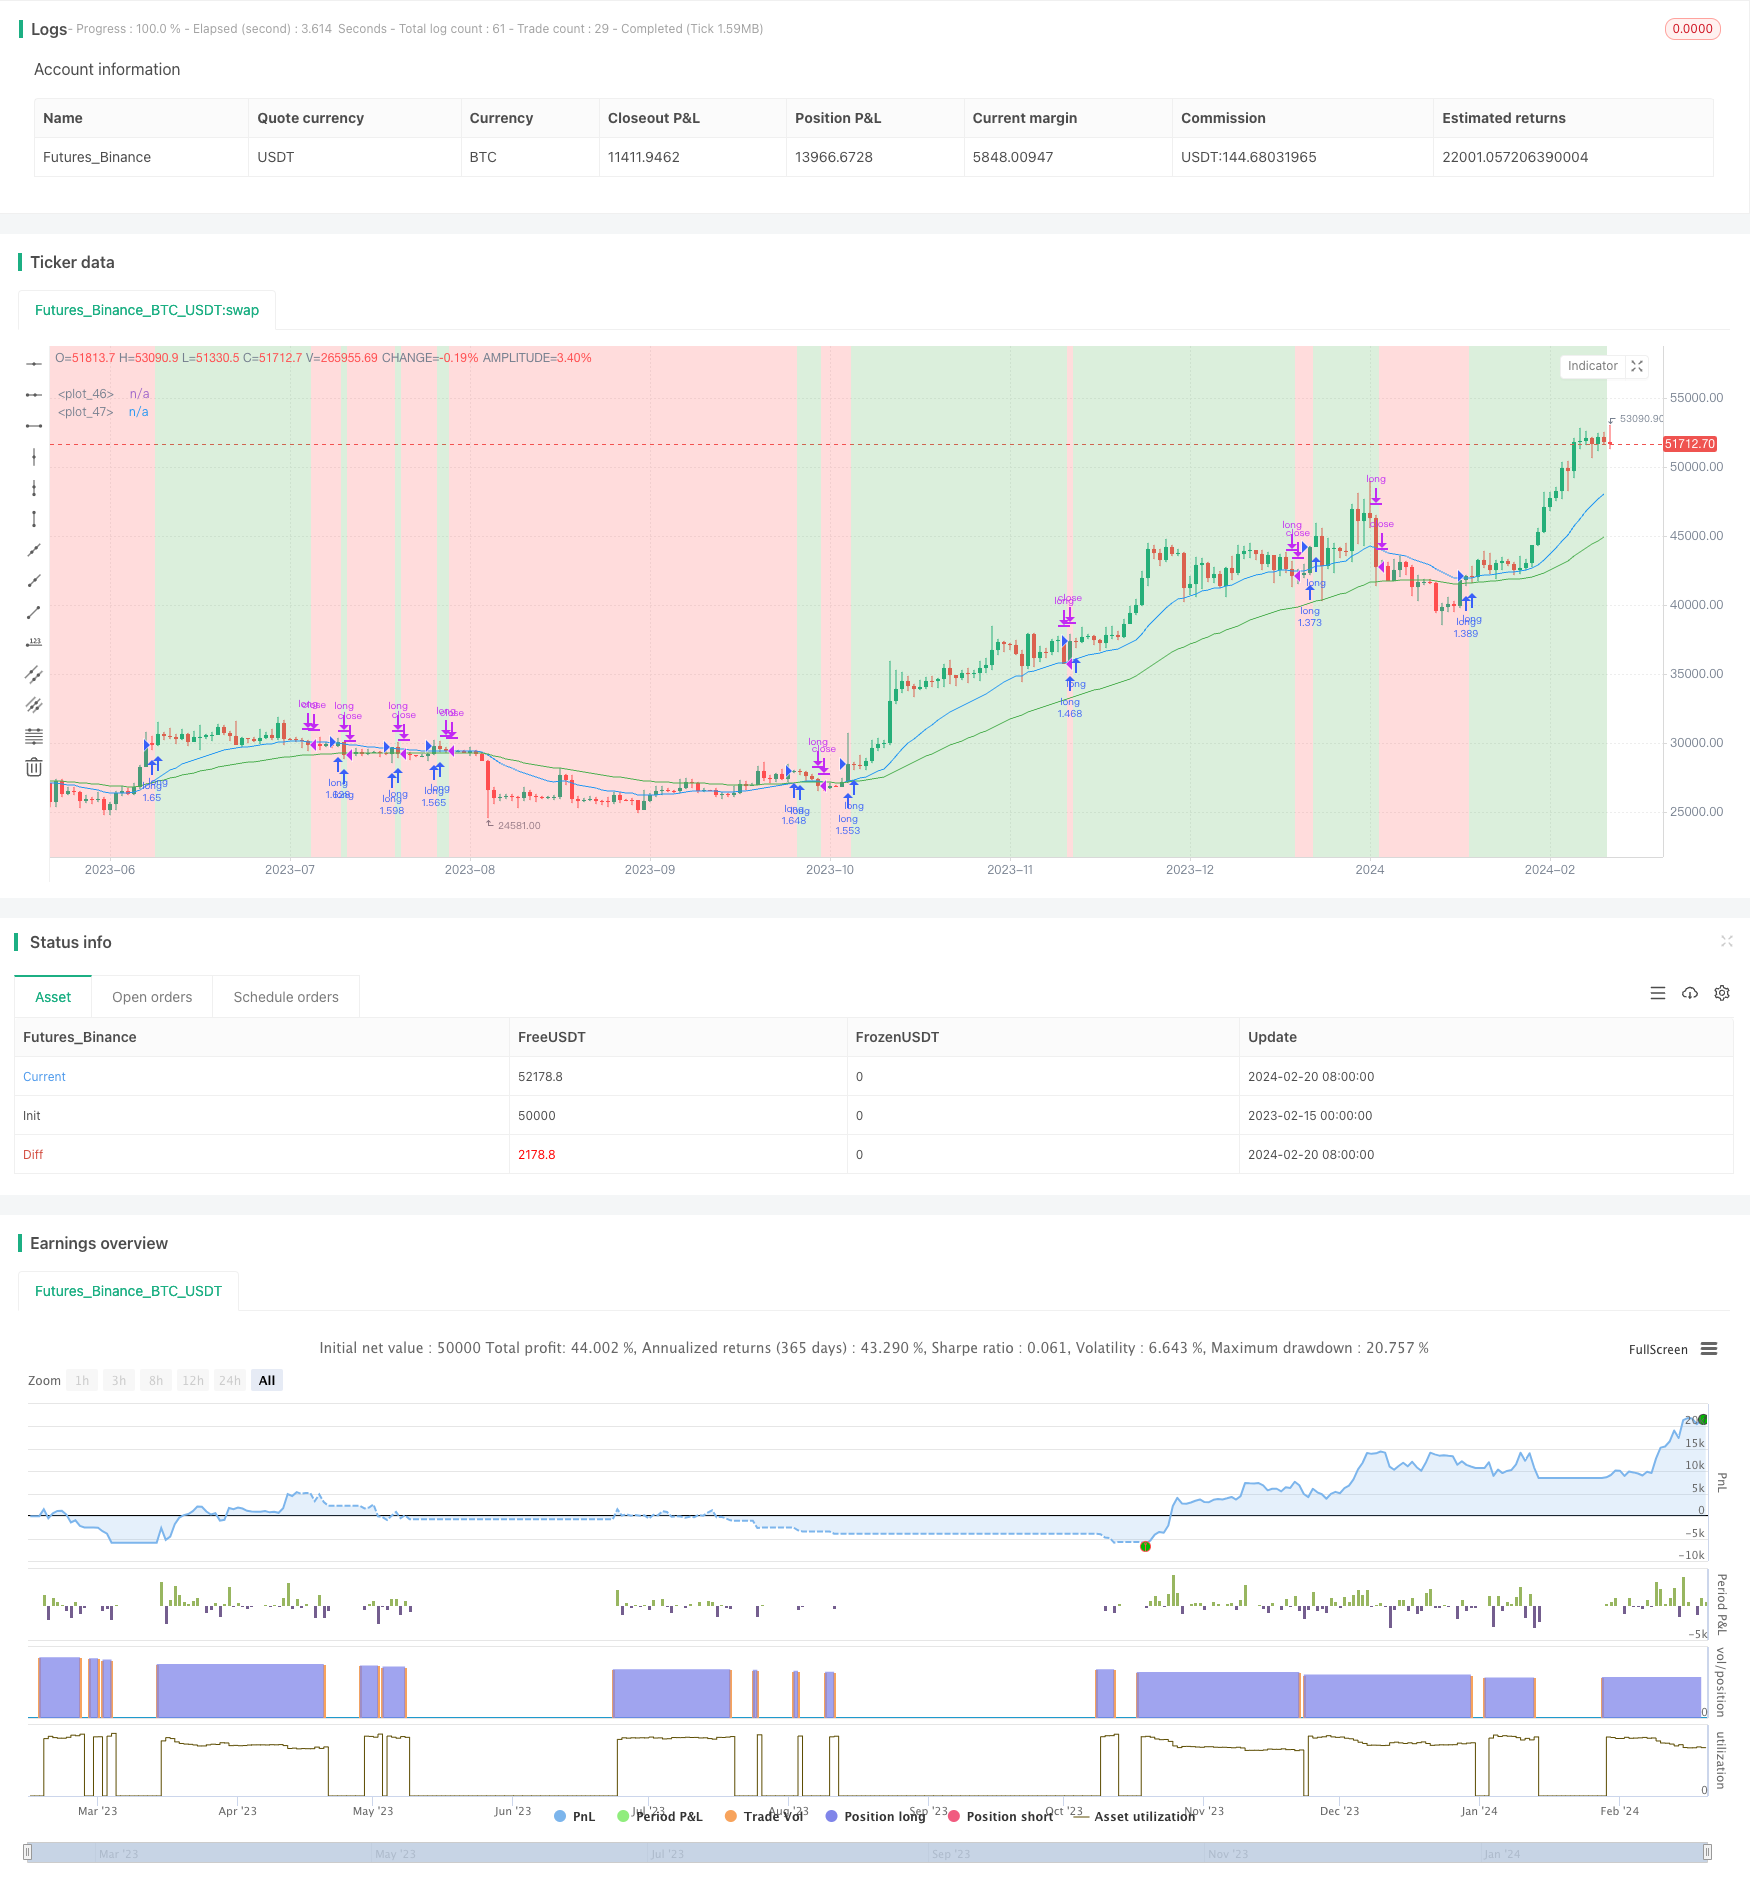
概述
该策略通过计算快速EMA均线和慢速EMA均线的交叉,判断市场趋势方向,实现趋势追踪交易。当快速EMA上穿慢速EMA时,做多;当价格跌破快速EMA时,平仓。
策略原理
策略通过输入快速期EMA平均线周期i_shortTerm和慢速期EMA平均线周期i_longTerm,分别计算出快速EMA和慢速EMA。当短期EMA上穿长期EMA(goLongCondition1条件),并且价格高于短期EMA(goLongCondition2条件)时,做多入场。当价格跌破短期EMA(exitCondition2条件)时,平仓退出。
该策略基于EMA平均线的黄金交叉原理,通过快慢EMA的交叉判断市场主要趋势,并跟踪趋势进行交易。当短期EMA上穿长期EMA时,表示市场步入趋势;当价格高于短期EMA时,表示目前处于趋势上行阶段,这样入场做多。当价格跌破短期EMA时,表示趋势反转 biosignal,应立即平仓。
优势分析
该策略主要有以下优势:
captured利用EMA平均线交叉判断市场主要趋势方向,避免被市场短期波动干扰,锁定主要趋势。
设置快慢EMA参数,可以调整对趋势判断的敏感度,灵活适应不同行情。
策略逻辑简单清晰,容易理解实现,适合量化交易初学者。
可自定义EMA周期参数,针对不同品种和市场调整参数,优化策略效果。
利用价格突破EMA退出止损,可有效控制风险,保护资金。
风险分析
该策略也存在一些风险:
当趋势反转时,EMA交叉信号会较价格转折慢一些,可能带来较大亏损。
作多突破短期EMA入场时,可能出现假突破带来损失。
paramedic参数设置不当也会影响策略效果。
效果与市场走势密切相关,不适合所有的品种和阶段。
对应的风险管理措施有:
优化EMA参数,提高对趋势反转的敏感度。
添加其他指标过滤确定入场时机。
debug参数不断优化,针对品种和市场调整。
充分了解策略适用场景,避免盲目使用。
优化方向
该策略可以从以下几个方面进行优化:
利用MACD、KD等其他指标过滤信号,优化入场时机。
添加移动止损,跟踪利润,进一步控制风险。
结合波动率指标ATR优化止损位置。
测试更科学的EMA参数设定方法,进一步优化参数。
多时间框架验证信号,提高信号准确性。
尝试BREAKOUT改进策略,在趋势加速阶段捕捉更大行情。
总结
本策略通过EMA平均线交叉判断市场主要趋势方向,实现简单有效的趋势追踪交易。策略逻辑清晰易于实现,风险可控,适合量化交易初学者练习。通过进一步优化参数设定、入场过滤和止损方法,可以获得更好的策略效果。但任何策略都有其局限性,用户在实盘中应充分考虑市场环境,审慎使用。
/*backtest
start: 2023-02-15 00:00:00
end: 2024-02-21 00:00:00
period: 1d
basePeriod: 1h
exchanges: [{"eid":"Futures_Binance","currency":"BTC_USDT"}]
*/

// This Pine Script™ code is subject to the terms of the Mozilla Public License 2.0 at https://mozilla.org/MPL/2.0/
// © pradhan_abhishek

//@version=5
strategy('EMA cross-over strategy by AP', overlay=true, shorttitle='EMACS-AP', initial_capital=100000, default_qty_value=100, default_qty_type=strategy.percent_of_equity, commission_value=0.025)

// inputs
i_shortTerm = input(title='Fast EMA', defval=21)
i_longTerm = input(title='Slow EMA', defval=55)
// select backtest range: if this is not given, then tradingview goes back since inception / whereever it finds data
i_from = input(defval = timestamp("01 Jan 2023 00:00"), title = "From")
i_to = input(defval = timestamp("31 Dec 2033 23:59"), title = "To")
i_showBg = input(defval = true, title = "Show In-trade / Out-trade background")

// create date function "within window of time"
date() => true

// exponential moving average (EMA) variables, derived from input parameters
shortTermEMA = ta.ema(close, i_shortTerm)
longTermEMA = ta.ema(close, i_longTerm)
atr = ta.atr(14)

// ### Trade strategy: begins ###
inTrade = strategy.position_size > 0
notInTrade = strategy.position_size <= 0

goLongCondition1 = shortTermEMA > longTermEMA
goLongCondition2 = close > shortTermEMA

// exitCondition1 = shortTermEMA < midTermEMA
exitCondition2 = close < shortTermEMA

// enter if not in trade and long conditions are met
if date() and goLongCondition1 and goLongCondition2 and notInTrade
    strategy.entry('long', strategy.long)
    // exit on stop-Loss hit
    stopLoss = close - atr * 3
    strategy.exit('exit', 'long', stop=stopLoss)

// exit if already in trade and take profit conditions are met
if date() and exitCondition2 and inTrade
    strategy.close(id='long')
// ###Trade strategy: ends ###

// plot emas & background color for trade status
plot(shortTermEMA, color=color.new(color.blue, 0))
plot(longTermEMA, color=color.new(color.green, 0))
trade_bgcolor = notInTrade ? color.new(color.red, 75) : color.new(color.green, 75)
bgcolor(i_showBg ? trade_bgcolor : color.new(color.white, 75))