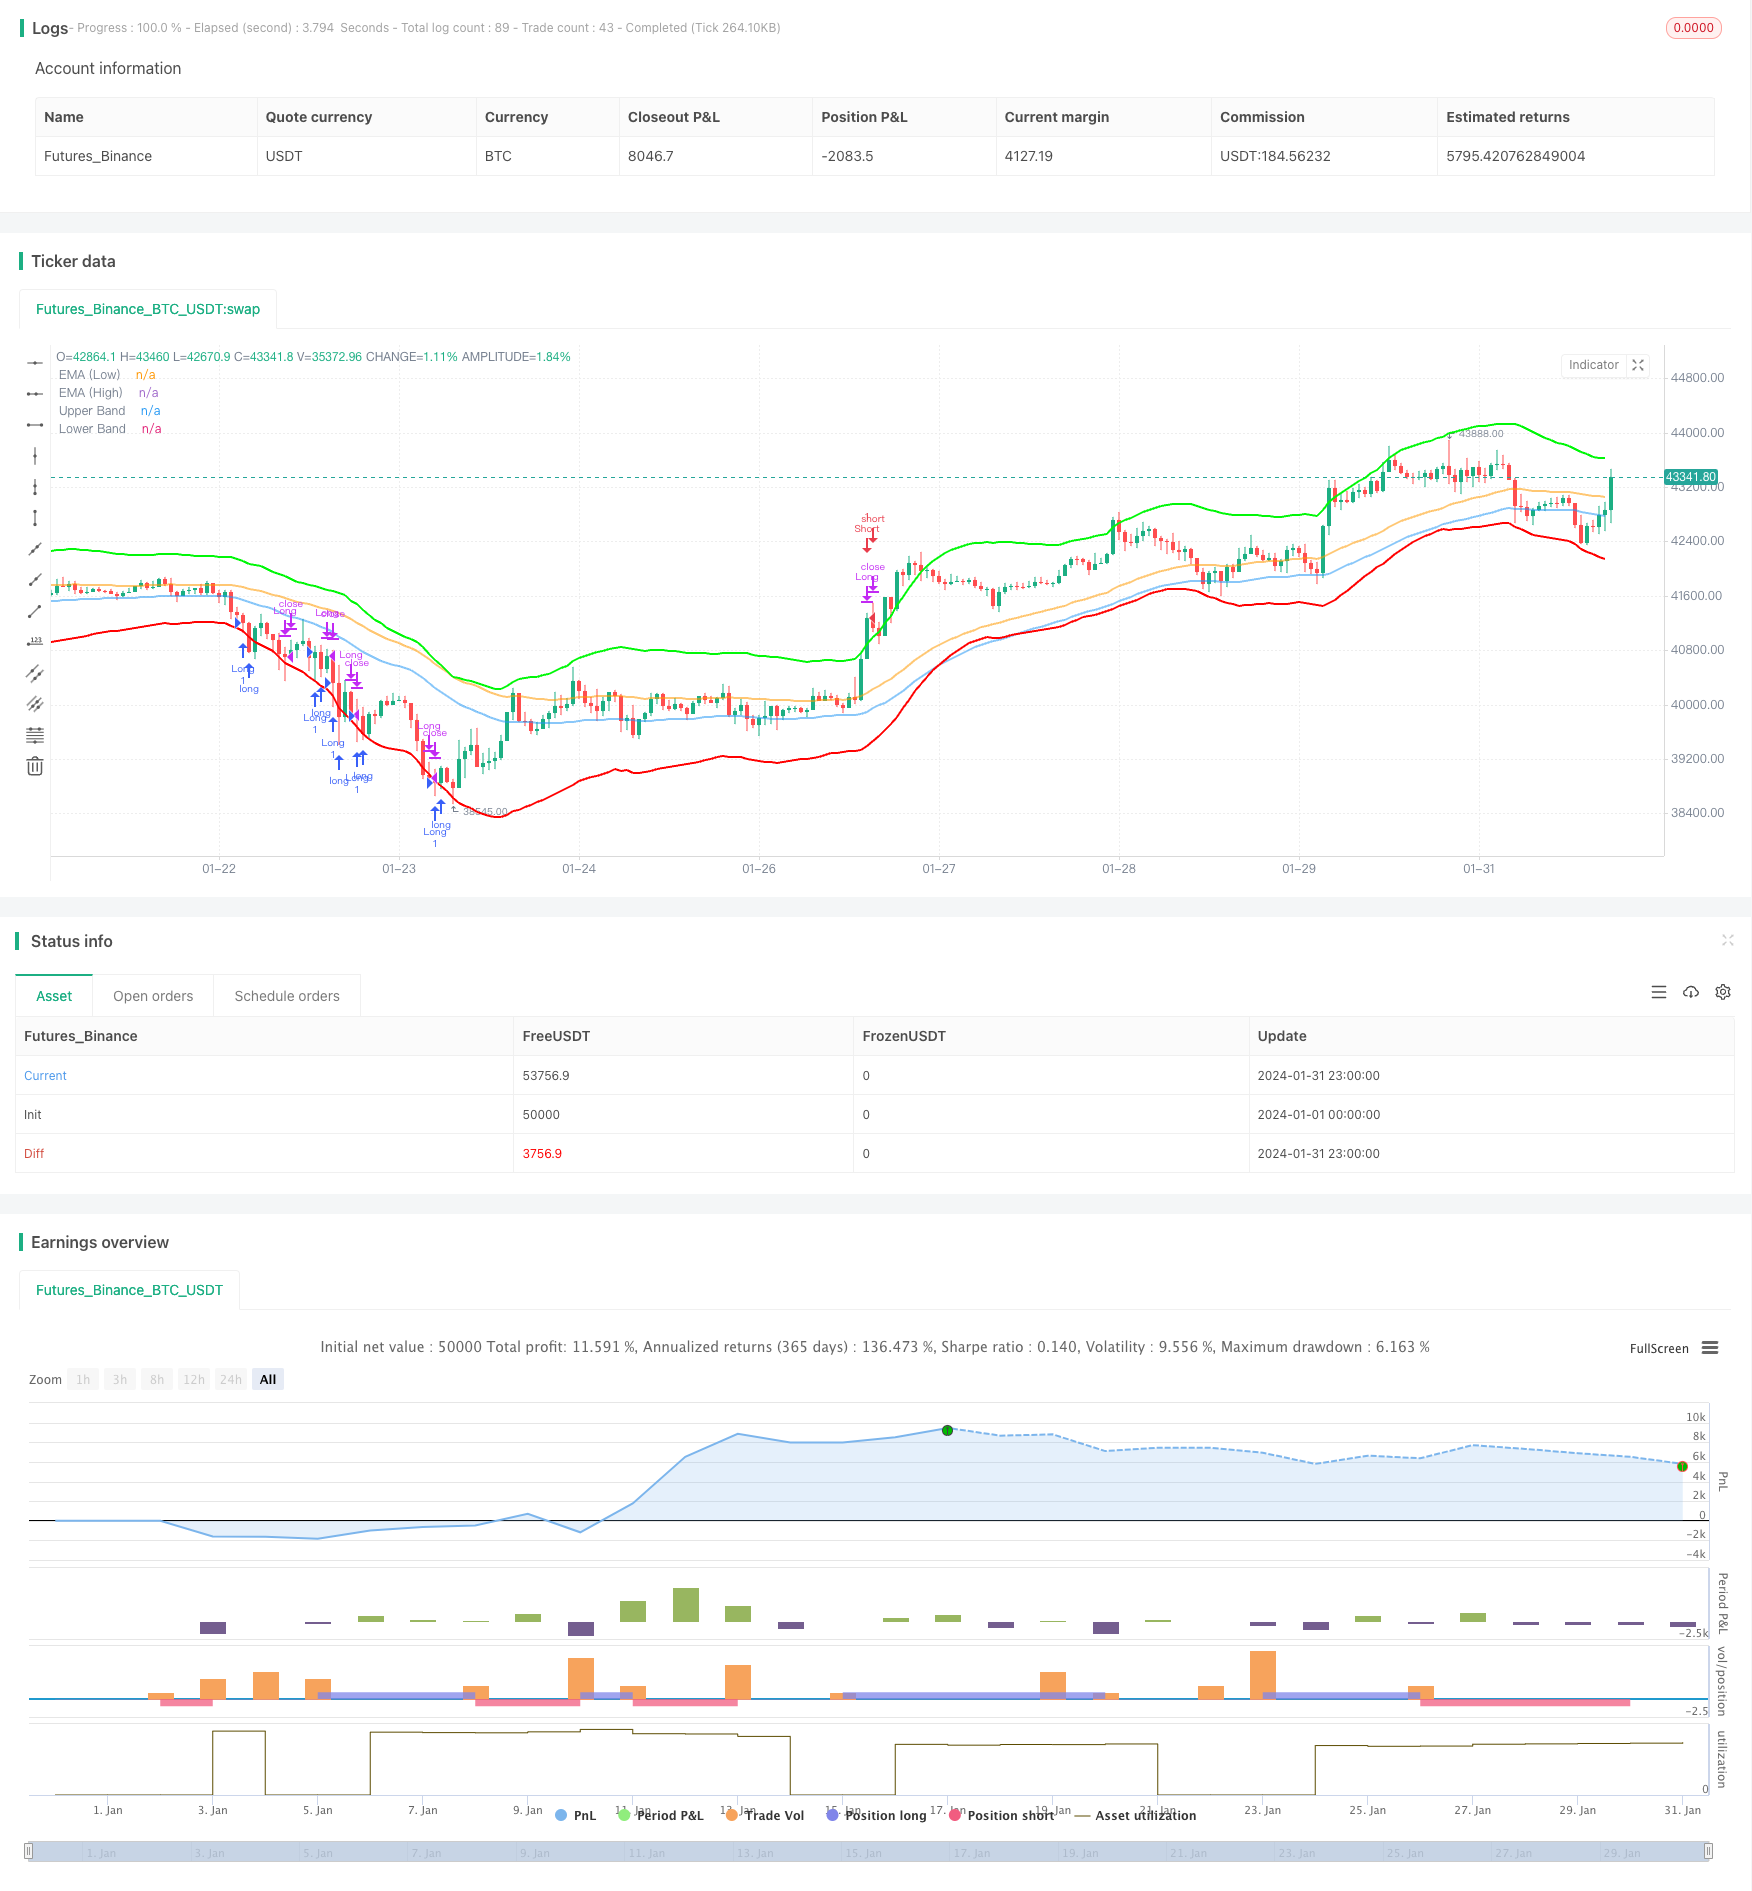
概述
本策略是一种趋势跟踪策略,它结合了Nadaraya-Watson回归和ATR通道来识别趋势方向和入场点。当价格突破下轨时,做多;当价格突破上轨时,平仓。同时设置了止损机制。
策略原理
首先,该策略使用 Nadaraya-Watson 核回归来计算两个不同滞后期的回归曲线,然后比较两条回归曲线的交叉来判断趋势方向。具体来说,分别计算 h期和 h-lag期的回归曲线,当 h-lag期曲线上穿 h期曲线时判断为看多;当 h-lag期曲线下穿 h期曲线时判断为看空。
其次,该策略使用ATR通道来确定入场点。上轨为回归曲线加上n期ATR的乘数,下轨为回归曲线减去n期ATR的乘数。当价格突破上轨时看空并入场,突破下轨时看多并入场。
最后,设置了止损机制。如果价格连续stopLossBars根K线低于入场价,则止损出场。
策略优势分析
这种策略结合回归分析和通道 breakthrough,能比较准确地把握市场趋势的方向和力度。相比单一使用移动均线等指标识别趋势,这种方法减少了假信号,从而提高了策略的稳定性。
另外,ATR通道设置了合理的入场点,避免在趋势反转点附近错误入场。止损机制也有效控制了单笔损失。
所以,这种策略具有识别趋势能力强、出入场比较准确、单笔止损风险可控等优势。
风险分析
这种策略最大的风险在于当突破ATR通道时,价格可能就是在做反转或者盘整,从而导致不适合入场或者入场后很快就止损出场。
另外,回归曲线和ATR通道都需要一定参数优化。如果参数设置不当,回归分析效果不佳,或者ATR幅度过大过小,都会影响策略的效果。
优化方向
可以考虑结合其他指标判断趋势和反转信号,例如VOLUME,MACD等,以提高策略的稳定性和准确性。
回归分析中的核函数也可以调整,如考虑Epanechnikov核等,看是否能获得更好的拟合效果。
ATR通道的ATR周期和乘数也需要反复测试优化,找到最佳的参数组合。
总结
本策略综合运用回归分析和通道突破方法,识别趋势方向和力度,在合理点位入场,并设置止损,从而实现稳定的趋势跟踪策略。次策略优化空间还很大,值得进一步测试改进。
/*backtest
start: 2024-01-01 00:00:00
end: 2024-01-31 23:59:59
period: 1h
basePeriod: 15m
exchanges: [{"eid":"Futures_Binance","currency":"BTC_USDT"}]
*/

//@version=5
strategy("Custom Strategy with Stop Loss and EMA", overlay=true)

src = input(close, title='Source')
h = input(10, title='Lookback Window', tooltip='The number of bars used for the estimation.')
r = input(10, title='Relative Weighting', tooltip='Relative weighting of time frames.')
x_0 = input(50, title='Start Regression at Bar',  tooltip='Bar index on which to start regression.')
lag = input(2, title='Lag', tooltip='Lag for crossover detection.')
stopLossBars = input(3, title='Stop Loss Bars', tooltip='Number of bars to check for stop loss condition.')
emaPeriod = input(46, title='EMA Period',  tooltip='Period for Exponential Moving Averages.')

lenjeje = input(32, title='ATR Period', tooltip='Period to calculate upper and lower band')
coef = input(2.7, title='Multiplier', tooltip='Multiplier to calculate upper and lower band')

// Function for Nadaraya-Watson Kernel Regression
kernel_regression1(_src, _size, _h) =>
    _currentWeight = 0.0
    _cumulativeWeight = 0.0
    for i = 0 to _size + x_0
        y = _src[i]
        w = math.pow(1 + (math.pow(i, 2) / ((math.pow(_h, 2) * 2 * r))), -r)
        _currentWeight += y * w
        _cumulativeWeight += w
    [_currentWeight, _cumulativeWeight]

// Calculate Nadaraya-Watson Regression
[currentWeight1, cumulativeWeight1] = kernel_regression1(src, h, h)
yhat1 = currentWeight1 / cumulativeWeight1
[currentWeight2, cumulativeWeight2] = kernel_regression1(src, h-lag, h-lag)
yhat2 = currentWeight2 / cumulativeWeight2

// Calculate Upper and Lower Bands
upperjeje = yhat1 + coef * ta.atr(lenjeje)
lowerjeje = yhat1 - coef * ta.atr(lenjeje)

// Plot Upper and Lower Bands
plot(upperjeje, color=color.rgb(0, 247, 8), title="Upper Band", linewidth=2)
plot(lowerjeje, color=color.rgb(255, 0, 0), title="Lower Band", linewidth=2)

// Calculate EMAs
emaLow = ta.ema(low, emaPeriod)
emaHigh = ta.ema(high, emaPeriod)

// Plot EMAs
plot(emaLow, color=color.rgb(33, 149, 243, 47), title="EMA (Low)", linewidth=2)
plot(emaHigh, color=color.rgb(255, 153, 0, 45), title="EMA (High)", linewidth=2)

// Long Entry Condition
longCondition = low < lowerjeje
strategy.entry("Long", strategy.long, when=longCondition)

// Stop Loss Condition
stopLossCondition = close[1] < strategy.position_avg_price and close[2] < strategy.position_avg_price and close[3] < strategy.position_avg_price
strategy.close("Long", when=stopLossCondition)

// Close and Reverse (Short) Condition
shortCondition = high > upperjeje
strategy.close("Long", when=shortCondition)
strategy.entry("Short", strategy.short, when=shortCondition)