概述
双均线压力回调策略是一个非常简单的股票指数避险策略。它只进行多头交易,在长期趋势向上时,当价格接近压力位时建仓,避免在市场突破压力位大涨后才入场,从而锁定较优购买价位。
策略原理
该策略同时使用长期200日移动平均线和短期10日移动平均线。只有当收盘价高于200日线即长期趋势向上时,才可以打开仓位。当收盘价低于10日线时,视为股票指数处于压力区域,这时如果RSI指标小于30,表明股价可能反弹,这时做多开仓。
一旦开仓后,设置5%的止损和10%的止盈退出交易。此外,如果价格突破10日线向上时,也主动止盈。
优势分析
双均线压力回调策略最大的优势在于其趋势跟随能力强。通过采用长短双均线,它可以有效判断长期趋势的方向。当长期趋势向上时,才会考虑打开多头仓位。这可以避免盲目做多带来的风险。
其次,该策略的入场时机选择非常精准。它利用均线区间带来的压力,结合超买超卖指标判断,选取反弹的最优时机进场。这可以使得入场价位比较优越,有利于获得更大的盈利空间。
风险分析
双均线压力回调策略的最大风险在于,它容易产生多次小幅止损。当价格在压力区域反复横跳时,就很容易不断触发止损。这种情况下会面临多次小额损失的风险。
另外,如果判断长期趋势错误,以至于进场后发生突破压力位大幅上涨的情况,这时止损可能较大,带来更大的风险。
为了控制风险,可以适当宽松止损幅度,增加持仓周期。同时也要慎重判断长期趋势,避免错误的多头仓位带来的风险。
优化方向
该策略可以从以下几个方面进行优化:
增加更多因素判断长期趋势。除了单纯的移动平均线外,可以引入基本面因素、交易量变化等更多指标,对长期趋势做出更准确的判断。
优化入场时机选择。可以在突破压力位前,判断是否存在量能明显放大的特征,这有利于判断反弹的力度和Amplitude。
优化止盈方式。现有的止盈方式较为被动,无法持续截取涨幅。可以研究trail stop等更动态的止盈方式,在保证风险可控的前提下,获取更多涨幅。
优化仓位管理。可以根据大盘波动的幅度,实时调整仓位。这可以降低盈亏波动,获得更为稳定的收益曲线。
总结
双均线压力回调策略是一个简单实用的避险策略。它可以有效跟踪长期趋势,选择优质的反弹时机开仓。通过止损和止盈来锁定收益,避免风险。该策略理论基础简单,适合大多数人使用,是一个不错的避险策略选择。
通过优化入场时机选择、动态止盈方式、与仓位管理等,该策略还具备很大的改进潜力,值得进一步研究。
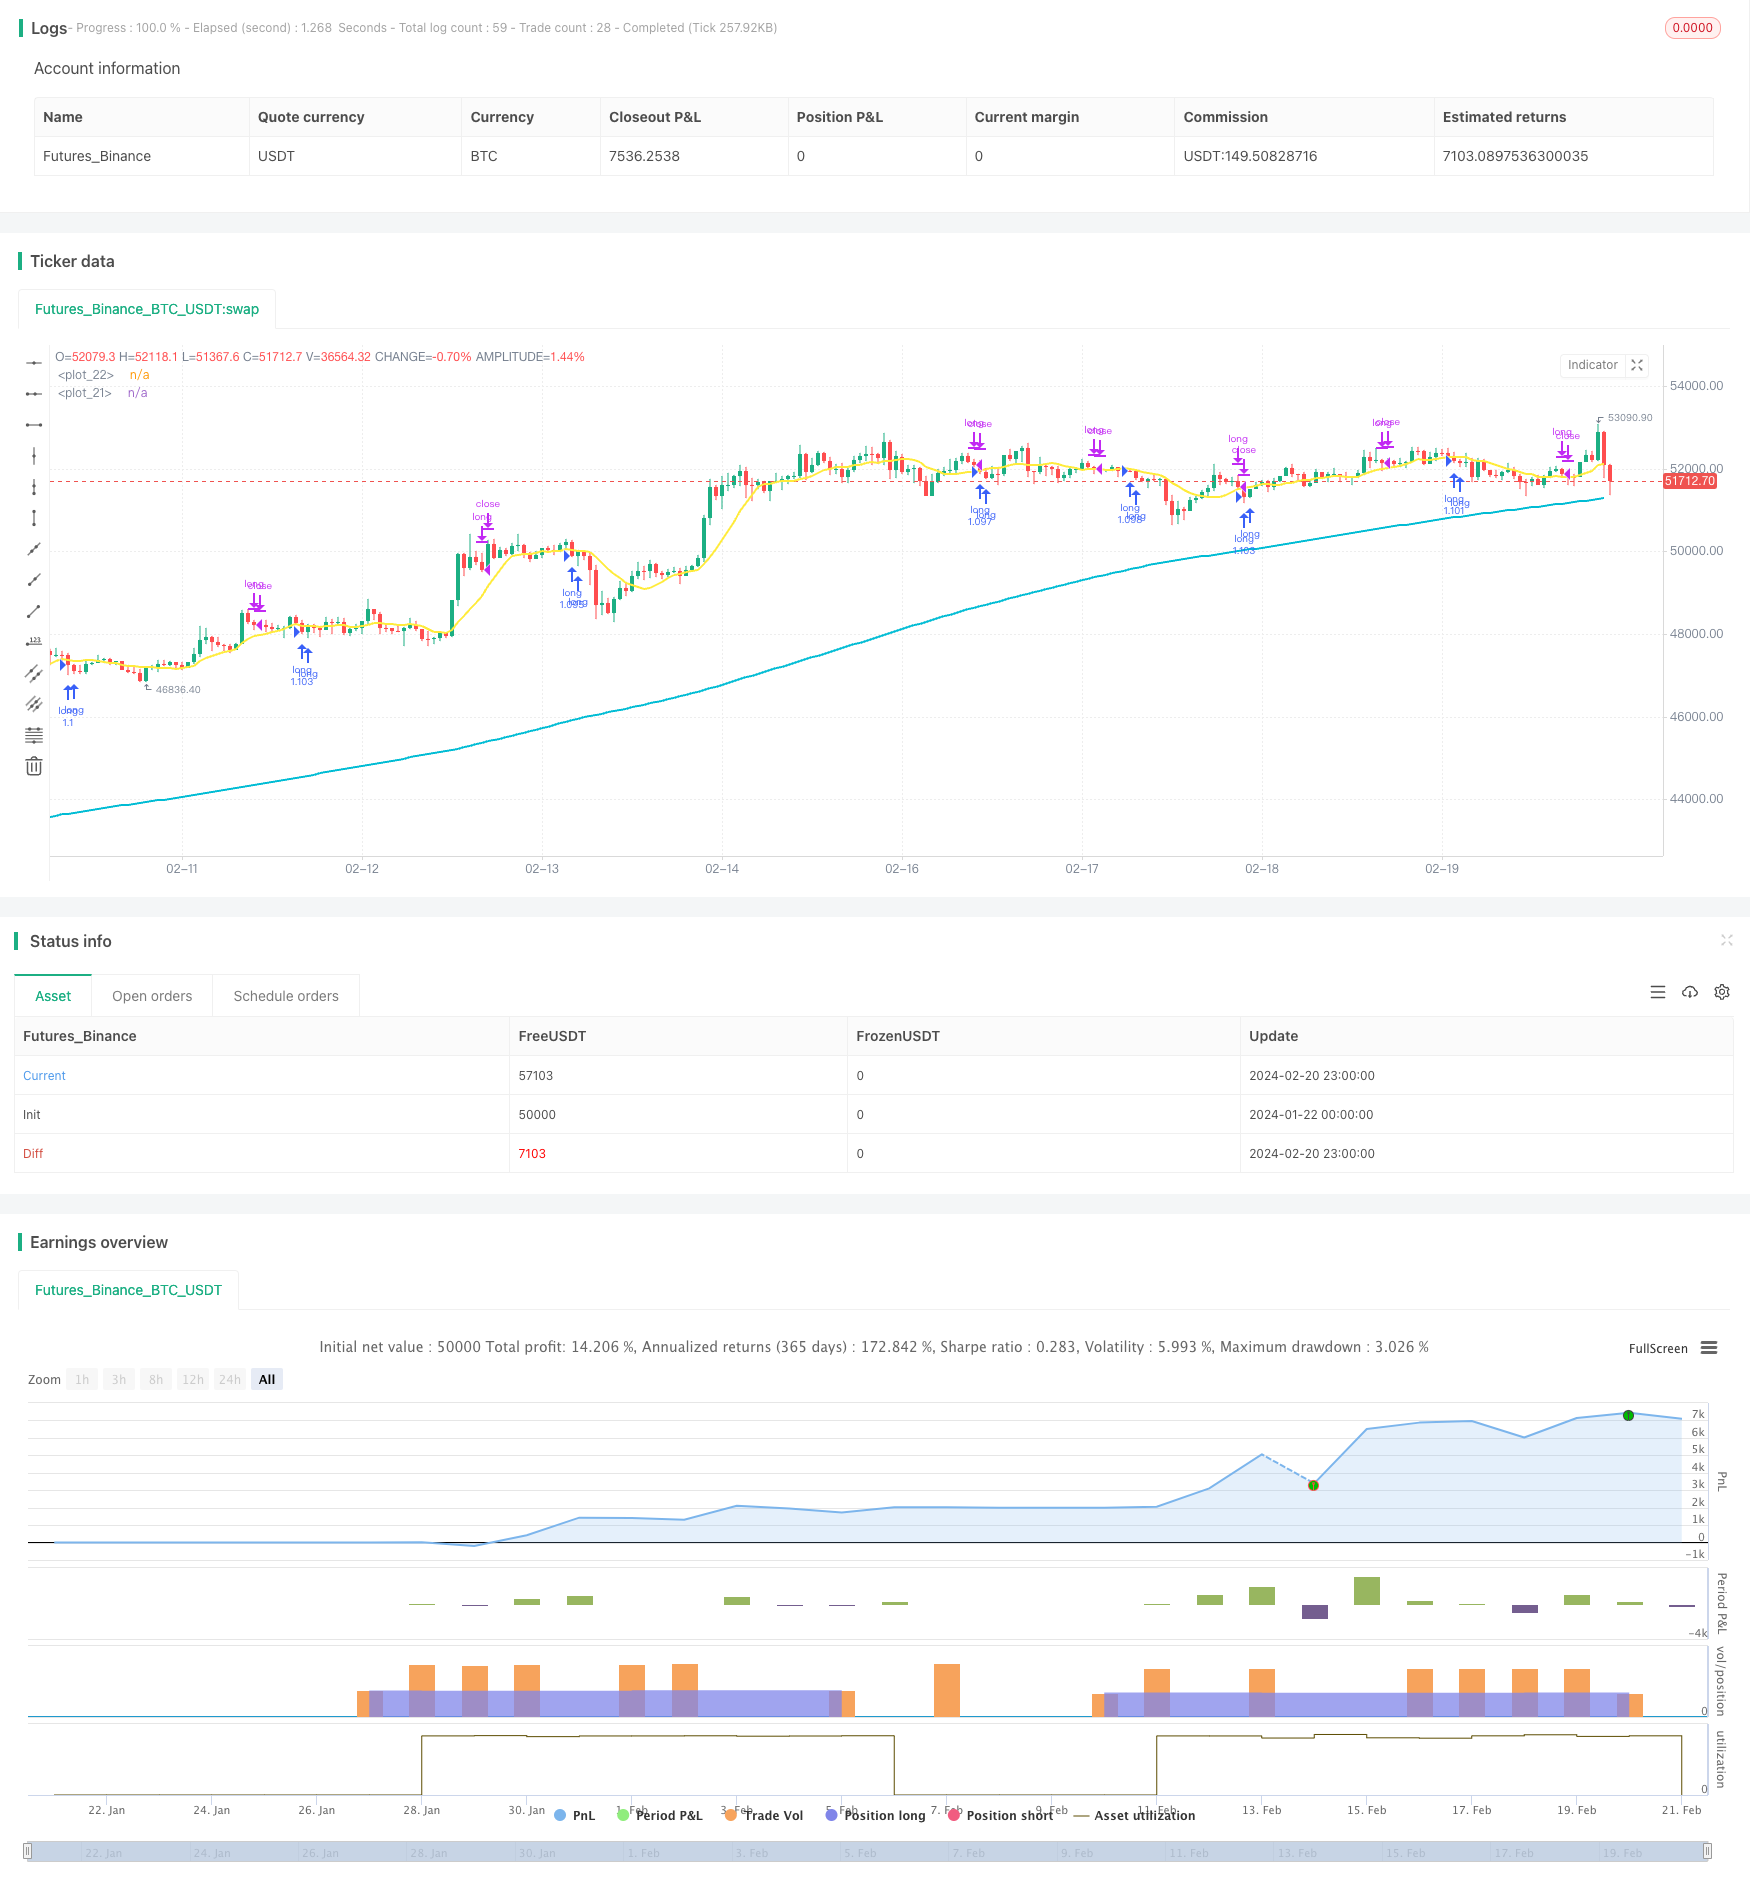
/*backtest
start: 2024-01-22 00:00:00
end: 2024-02-21 00:00:00
period: 1h
basePeriod: 15m
exchanges: [{"eid":"Futures_Binance","currency":"BTC_USDT"}]
*/

// This source code is subject to the terms of the Mozilla Public License 2.0 at https://mozilla.org/MPL/2.0/
// © tsujimoto0403

//@version=5
strategy("simple pull back", overlay=true,default_qty_type=strategy.percent_of_equity,
     default_qty_value=100)

//input value
malongperiod=input.int(200,"長期移動平均BASE200/period of long term sma",group = "パラメータ")
mashortperiod=input.int(10,"長期移動平均BASE10/period of short term sma",group = "パラメータ")
stoprate=input.int(5,title = "損切の割合%/stoploss percentages",group = "パラメータ")
profit=input.int(20,title = "利食いの割合%/take profit percentages",group = "パラメータ")
startday=input(title="バックテストを始める日/start trade day", defval=timestamp("01 Jan 2000 13:30 +0000"), group="期間")
endday=input(title="バックテスを終わる日/finish date day", defval=timestamp("1 Jan 2099 19:30 +0000"), group="期間")


//polt indicators that we use
malong=ta.sma(close,malongperiod)
mashort=ta.sma(close,mashortperiod)

plot(malong,color=color.aqua,linewidth = 2)
plot(mashort,color=color.yellow,linewidth = 2)

//date range
datefilter = true

//open conditions
if close>malong and close<mashort and strategy.position_size == 0 and datefilter and ta.rsi(close,3)<30
    strategy.entry(id="long", direction=strategy.long)

//sell conditions
strategy.exit(id="cut",from_entry="long",stop=(1-0.01*stoprate)*strategy.position_avg_price,limit=(1+0.01*profit)*strategy.position_avg_price)


if close>mashort and close<low[1] and strategy.position_size>0
    strategy.close(id ="long")