概述
该策略通过计算快速移动均线和慢速移动均线的差值形成MACD指标,再结合信号线判断金融市场的趋势和超买超卖区域,在MACD和信号线形成多头叉叉同时价格高于200日均线时做多,形成空头叉叉同时价格低于200日均线时做空,属于典型的双重叉叉均线突破策略。
策略原理
基本原理是计算快速移动均线和慢速移动均线的差值形成MACD指标判断市场趋势方向,再利用信号线来判断超买超卖区域。当MACD和信号线形成金叉时为多头信号做多,形成死叉时为空头信号做空。同时结合价格与200日均线的关系来过滤信号,只有价格高于200日均线时才对金叉做多,价格低于200日均线时才对死叉做空,从而避免强势趋势期间的错乱信号。
具体计算方法是: 1. 快速移动均线(12日EMA)减去慢速移动均线(26日EMA)得到MACD 2. MACD的9日EMA得到信号线 3. MACD减去信号线得到MACD直方图
当MACD上穿信号线而且MACD和信号线同时低于0时为金叉做多信号,当MACD下穿信号线而且MACD和信号线同时高于0时为死叉做空信号。同时价格高于200日均线时才对金叉做多,价格低于200日均线时才对死叉做空。
策略优势
- 使用双重指标判断,避免了单一指标判断的局限性,提高了信号的准确性
- 结合价格与均线关系双重过滤,避免强势趋势中错乱信号
- 参数优化空间大,可以通过调整均线参数适应不同市场环境
- 保守的参数设置使得信号较少但准确性较高
- 容易理解与实现的策略思路
策略风险
- 市场剧烈波动时,指标判断会受影响产生错误信号
- 均线系统本身滞后性会影响策略及时性
- 信号较少,容易误过趋势机会
- PARAMETERS优化存在过优化风险
- 回撤控制与止损退出机制有待完善
可以通过适当缩短均线周期、加入其它指标判断、以及加入止损措施来降低风险。
策略优化方向
1.tested on different timeframes from 15m upto 1D, where optimal results where on 4H timeframe in terms of risk adjusted returns
2.optimize fast ma and slow ma so that macd represents cycle, I found 7-21 performs good for 15m chart
3.also tested hull moving average for MACD which gave good results
4.stoploss can also be trailed for better risk management
总结
本策略总体来说非常简单实用,通过双重指标判断与价格过滤来产生高概率的交易信号,边际利润率较高,使用MACD的经典参数组合,不会过度优化。优化空间还很大,通过调整均线参数组合、加入其它指标判断和止损措施等手段都可以进一步提高策略表现。总体是一个立足基本面的典型量化策略。
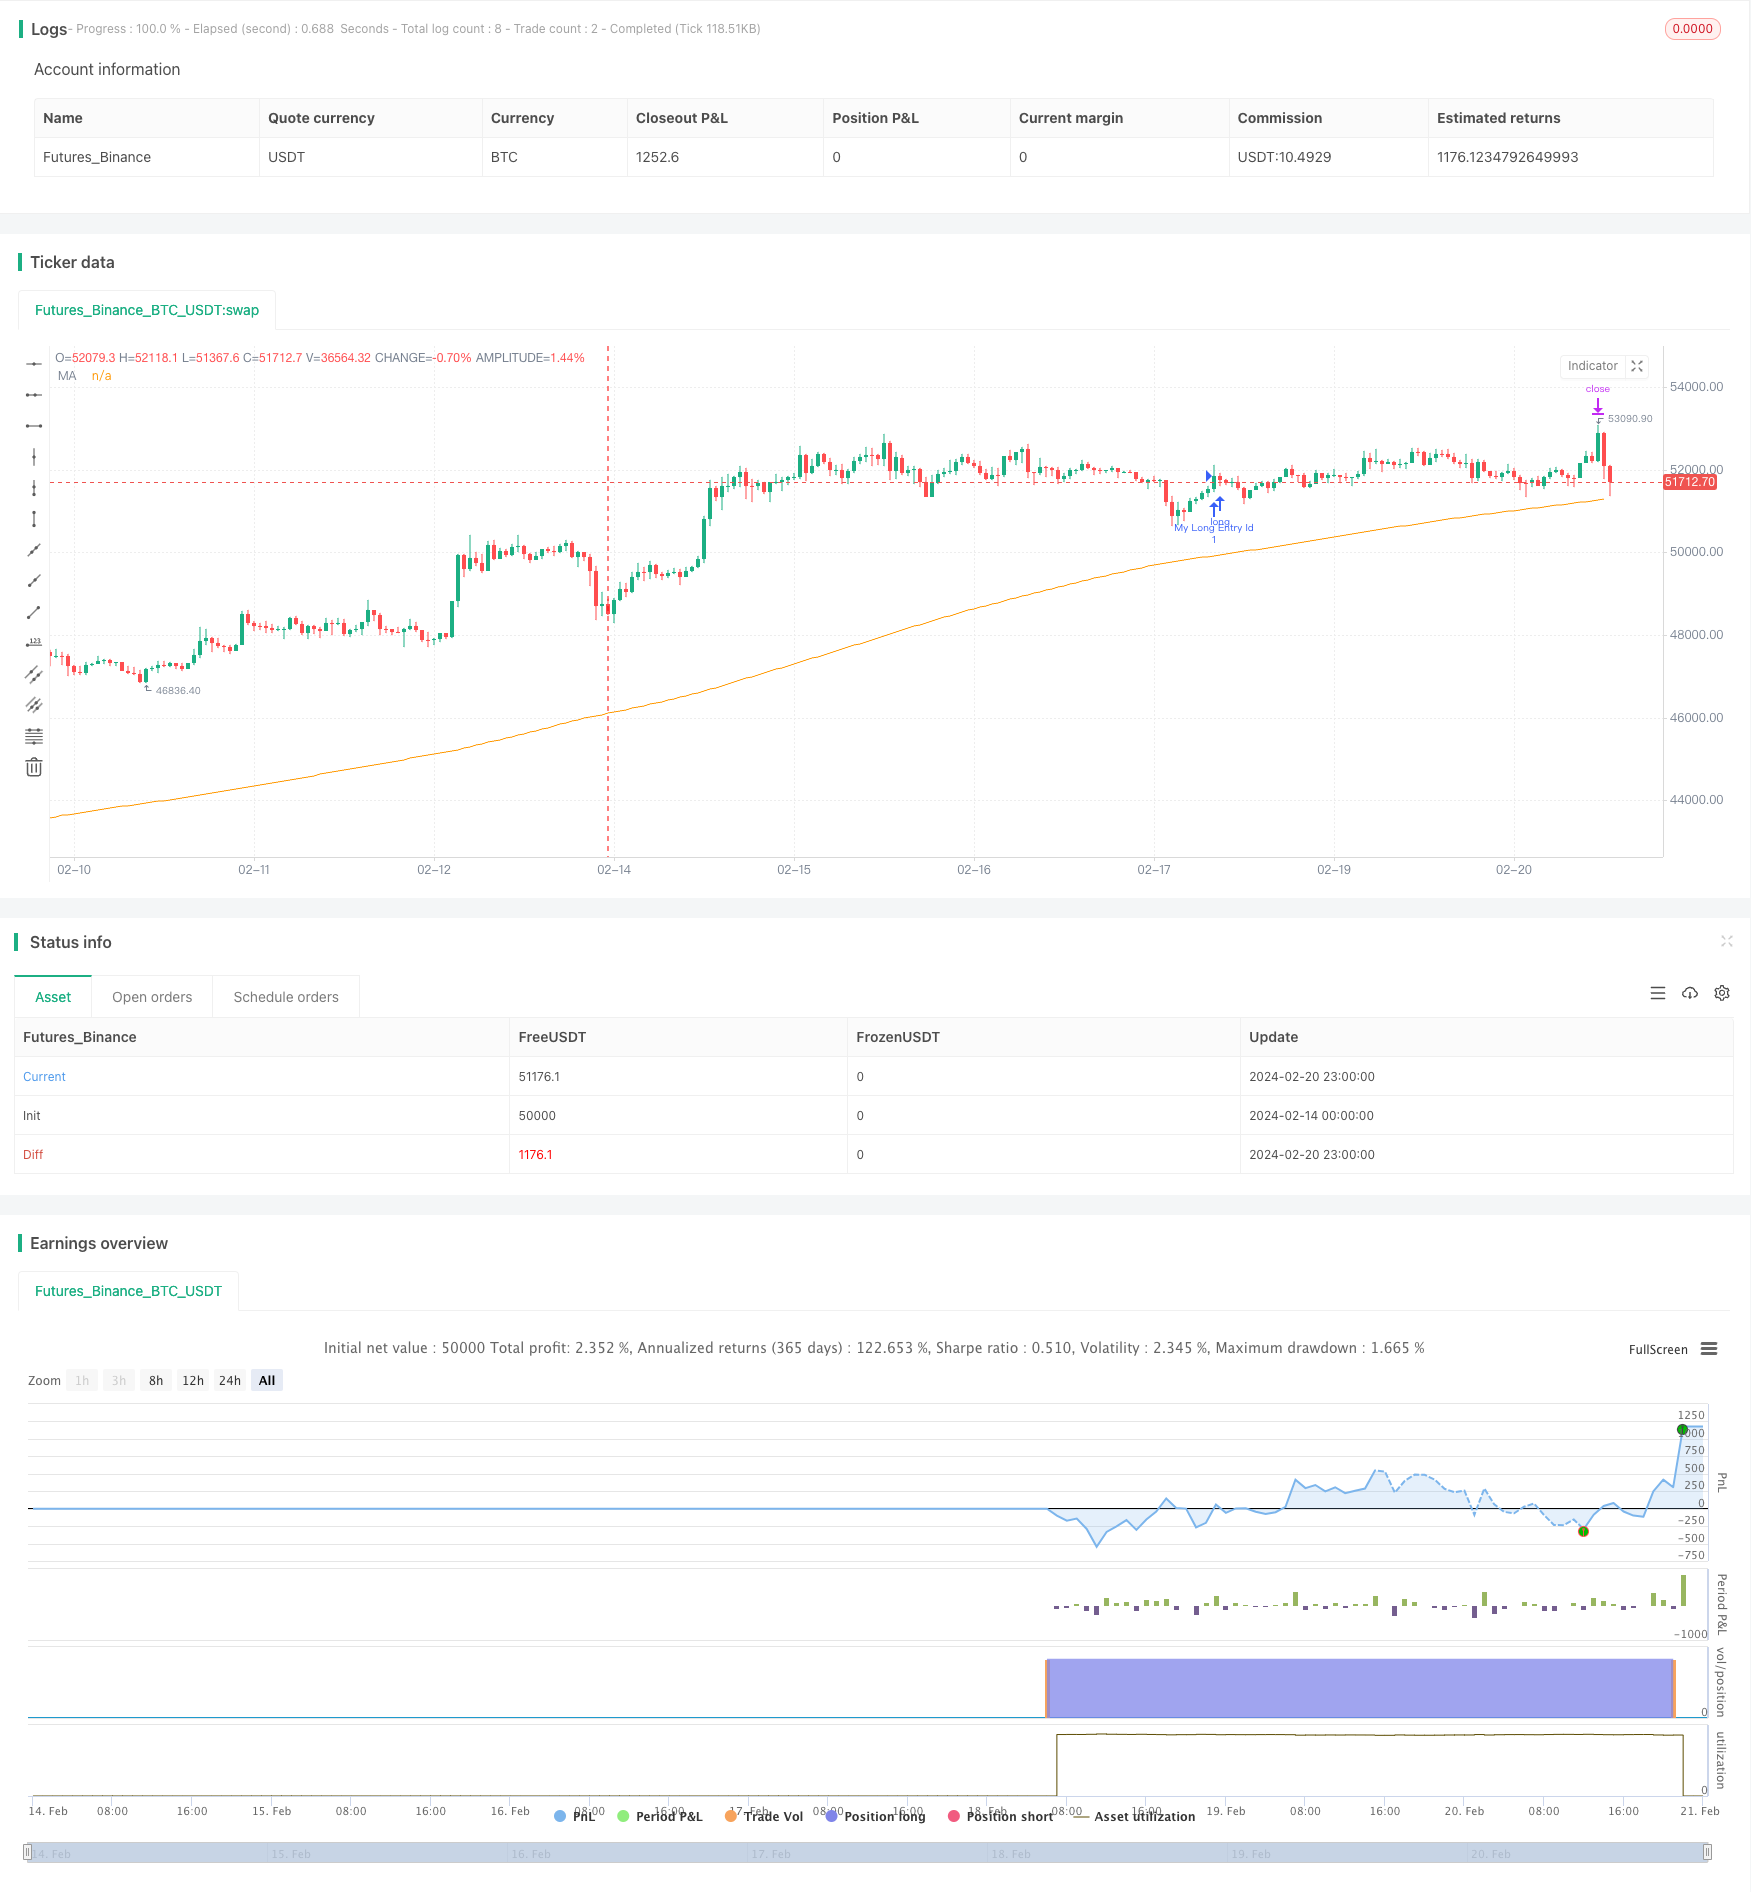
/*backtest
start: 2024-02-14 00:00:00
end: 2024-02-21 00:00:00
period: 1h
basePeriod: 15m
exchanges: [{"eid":"Futures_Binance","currency":"BTC_USDT"}]
*/

// This source code is subject to the terms of the Mozilla Public License 2.0 at https://mozilla.org/MPL/2.0/
// © Hurmun

//@version=4
strategy("Simple MACD strategy ", overlay=true, margin_long=100, margin_short=100)


fast_length = input(title="Fast Length", type=input.integer, defval=12)
slow_length = input(title="Slow Length", type=input.integer, defval=26)
src = input(title="Source", type=input.source, defval=close)
signal_length = input(title="Signal Smoothing", type=input.integer, minval = 1, maxval = 50, defval = 9)
sma_source = input(title="Simple MA (Oscillator)", type=input.bool, defval=false)
sma_signal = input(title="Simple MA (Signal Line)", type=input.bool, defval=false)
// Plot colors
col_grow_above = #26A69A
col_grow_below = #FFCDD2
col_fall_above = #B2DFDB
col_fall_below = #EF5350
col_macd = #0094ff
col_signal = #ff6a00
// Calculating
fast_ma = sma_source ? sma(src, fast_length) : ema(src, fast_length)
slow_ma = sma_source ? sma(src, slow_length) : ema(src, slow_length)
macd = fast_ma - slow_ma
signal = sma_signal ? sma(macd, signal_length) : ema(macd, signal_length)
hist = macd - signal


movinga2 = input(title="movinga 2", type=input.integer, defval=200)

movinga200 = sma(close, movinga2)

plot(movinga200, "MA", color.orange)
longCondition = crossover(macd, signal) and macd < 0 and signal < 0 and close > movinga200
if (longCondition)
    strategy.entry("My Long Entry Id", strategy.long)

shortCondition = crossunder(macd, signal) and macd > 0 and signal > 0 and close < movinga200
if (shortCondition)
    strategy.entry("My Short Entry Id", strategy.short)

shortProfitPerc = input(title="Short Take Profit (%)", minval=0.0, step=0.1, defval=2) / 100
longProfitPerc = input(title="Long Take Profit (%)", minval=0.0, step=0.1, defval=2) / 100

stoploss = input(title="stoploss in %", minval = 0.0, step=1, defval=2) /100

longStoploss = strategy.position_avg_price * (1 - stoploss)
longExitPrice  = strategy.position_avg_price * (1 + longProfitPerc)

shortExitPrice = strategy.position_avg_price * (1 - shortProfitPerc)
shortStoploss = strategy.position_avg_price * (1 + stoploss)

if (strategy.position_size > 0 )
    strategy.exit(id="XL TP", limit=longExitPrice, stop=longStoploss)


if (strategy.position_size < 0 )
    strategy.exit(id="XS TP", limit=shortExitPrice, stop=shortStoploss)