MyQuant Trend Identifier Strategy

Overview
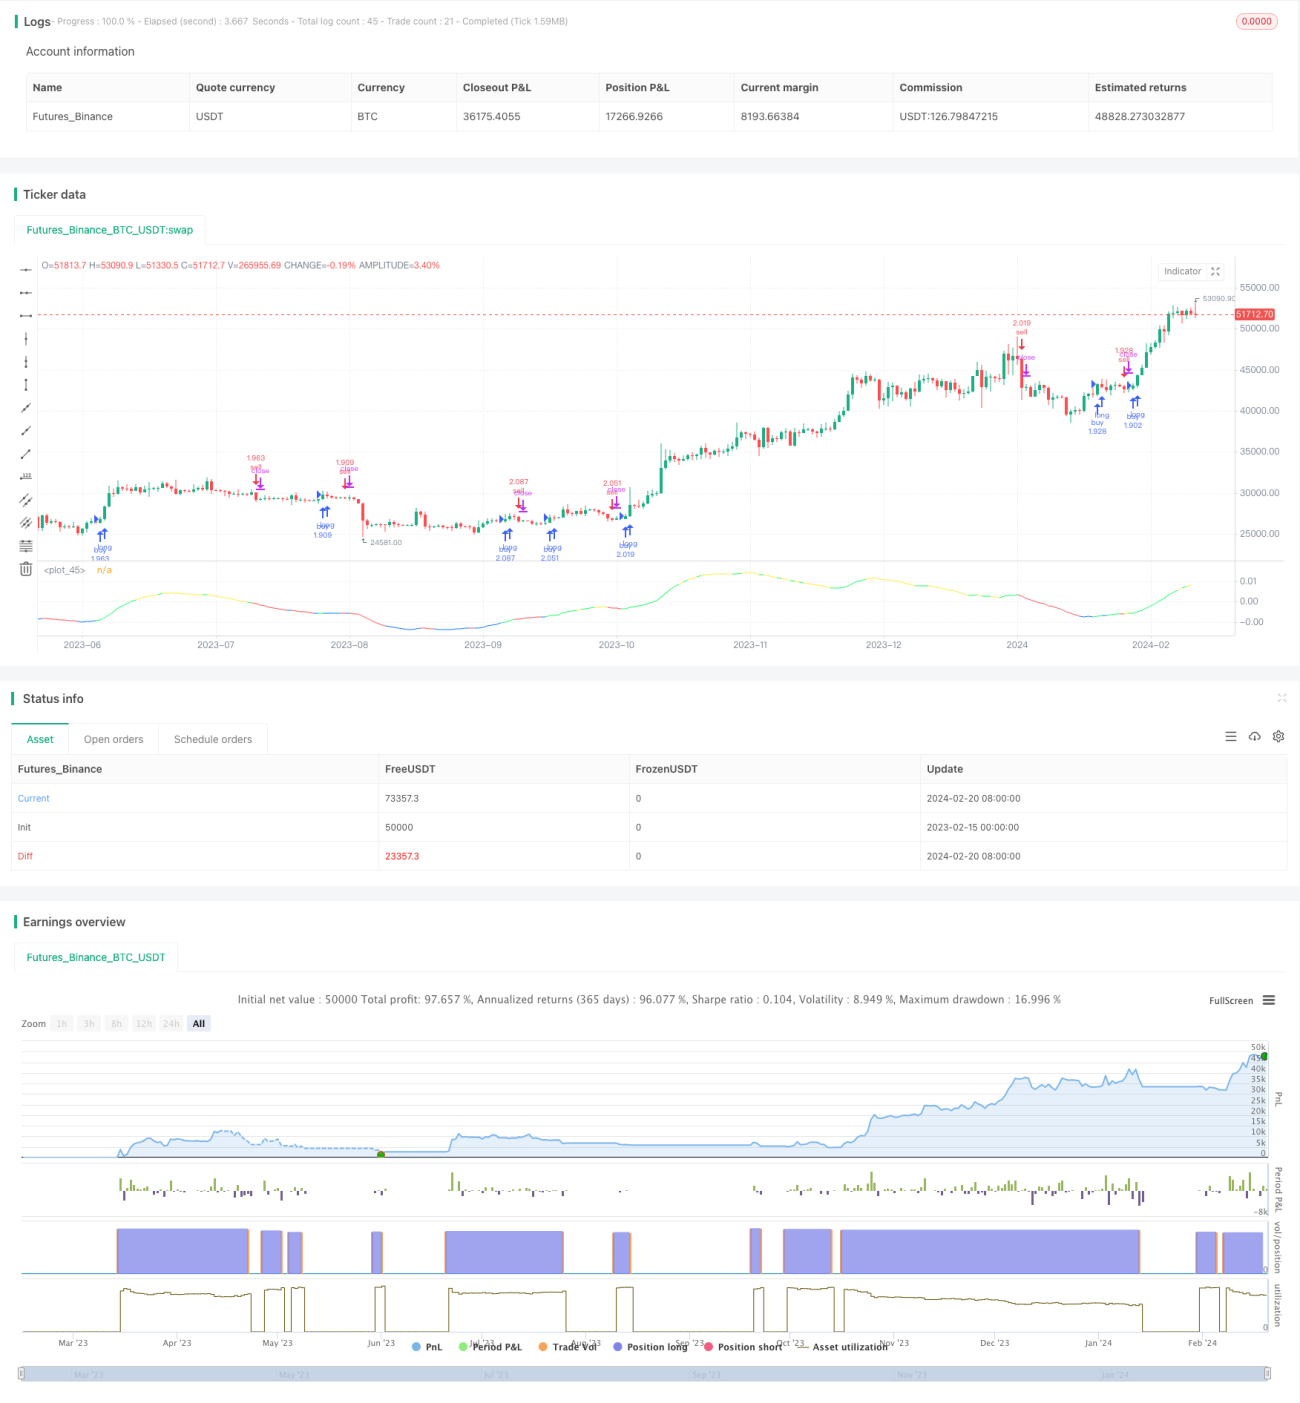
MyQuant Trend Identifier Strategy is a strategy for daily Bitcoin trading. It identifies market trends by calculating the moving average and its first and second order derivatives of the price, and makes buy and sell decisions accordingly.
Strategy Principle
The strategy first calculates the Adaptive Moving Average (ALMA) of the price and its first order and second order derivatives. The first order derivative reflects the rate of change of the price, and the second order derivative reflects the curvature of the price. It then judges the current trend to be upward, downward or fluctuating based on the values of the first and second order derivatives. Combined with stock indicators, it determines whether the buy or sell conditions are met.
Specifically, the strategy calculates the following indicators:
- ALMA: Adaptive Moving Average of the price, length 140, fast factor 1.1, sigma 6
- dema: First order derivative of ALMA
- d2ema: First order derivative of dema, reflecting second order derivative of the price
- index: Oscillation index of the dema indicator
- ind: Deviation index of the price from its moving average
When the buy condition is met, it calculates the number of shares to buy based on the signals from CAUSED Accumulation/Distribution Bands and Caused Exposure Top and Bottom Finder. When the sell condition is met, it sells all current positions.
Advantages of the Strategy
By combining trend and indicator judgments, this strategy can effectively identify turning points in market trends. Using the first and second order derivatives of prices to determine trends avoids the impact of price fluctuations and makes signals clearer. Compared to common moving average strategies, it has advantages such as higher accuracy.
Risk Analysis
This strategy is very sensitive to the selection of the trading time period and parameter adjustments. If the time period is selected improperly and important price turning points are not covered, the strategy will not be very effective. If the indicator parameters are set improperly, the buy and sell signals will be more affected by noise, thus impacting strategy returns. In addition, the stop loss conditions preset in the strategy also affect final returns.
Directions for Optimization
The strategy can be further optimized in the following aspects:
- Optimize logic for selecting time periods, through smarter selection of backtest and live trading time periods.
- Optimize indicator parameters, such as adjusting length of ALMA and dema etc.
- Add stop loss condition judgments to control maximum losses.
- Evaluate the effects across different cryptocurrencies and pick the ones that perform the best.
Conclusion
By calculating the first and second order derivatives of the adaptive moving average of prices, the MyQuant Trend Identifier Strategy effectively identifies the market trends for Bitcoin and makes corresponding buy and sell decisions. By combining multiple indicators for judgment, it avoids excessive noise interference with the signals. With further optimization of time and parameters, the performance of this strategy can be further improved.
- 1