概述
本策略名称为“基于RSI指标和ZigZag指标的加密货币15分钟趋势追踪策略”。该策略专门针对15分钟时间周期的加密货币市场(如ETHUSD/T、BTCUSD/T等)设计。策略通过结合RSI指标判断超买超卖与ZigZag指标判断价格跳动来确定趋势方向,属于典型的趋势跟踪策略。
策略原理
本策略的核心逻辑是同时使用RSI指标和ZigZag指标来判断价格趋势。具体来说,RSI指标判断价格是否超买或超卖,ZigZag指标判断价格是否发生指定百分比的大幅跳动。当两者同时发出交易信号时,我们判断趋势发生转折,可以进行反向操作。
关于RSI指标,我们设置超买线为75,超卖线为25。当RSI指标线从下向上穿过25时,认为行情由超卖转为看涨,当RSI指标线从上向下穿过75时,认为行情由看涨转为超卖。
关于ZigZag指标,我们设置价格跳动幅度阈值为1%。当价格出现1%以上的大幅跳动时,ZigZag指标线会发出信号。结合趋势判断,我们可以看出价格趋势的转折点。
在双指标发出信号时,如果之前趋势方向为看涨,现在RSI超买而ZigZag显示跳空缺口,那么我们判定行情见顶,此时可以考虑做空;反之,如果之前趋势方向为看跌,现在RSI超卖而ZigZag显示跳空缺口,那么我们判定行情见底,此时可以考虑做多。通过这样的逻辑,我们可以进行趋势跟踪操作。
策略优势
本策略最大的优势在于结合双指标判断,可以有效过滤假信号,提高信号质量。仅仅依靠单一指标很容易产生假信号,而本策略通过RSI指标和ZigZag指标的验证,可以过滤掉一些无效信号,从而提高交易胜率。
另一个优势是参数设置灵活。本策略中的RSI参数和ZigZag参数都是可以自定义的,我们可以根据不同市场的特点,调整参数以达到最佳效果。这赋予了策略很大的灵活性。
策略风险
本策略的主要风险在于指标发出错误信号的概率。尽管我们采用了双指标组合验证,但在市场剧烈波动的时候,仍然可能出现指标失效的情况,导致交易失误。此外,参数设置不当也会影响策略效果。
为降低风险,我们可以适当缩短仓位持有时间,及时止损。同时优化参数设置非常重要,需要充分考虑市场特点。当面临异常市场时,手动干预停止交易也是必要的。
策略优化方向
本策略可以从以下几个方面进行优化:
增加指标组合,引入更多指标进行综合判断,如KDJ、MACD等,可以进一步过滤信号。
引入机器学习算法,通过AI技术自动优化参数设置,适应市场变化。
增加自适应止损机制,能够根据市场波动幅度来动态调整止损距离。
优化仓位管理,比如根据趋势强弱分配资金等方法。
设定备选策略,在异常市场中自动切换。
总结
本策略整体来说是一种典型的趋势跟踪策略,核心思路是结合RSI指标和ZigZag指标来判断价格趋势转折点。策略优势在于双指标组合过滤误导信号,提高交易效率。需要充分考虑到指标失效风险,并不断通过参数优化、止损优化、仓位优化等手段进一步完善策略。总的来说,本策略为加密货币市场提供了一种有效的趋势跟踪解决方案。
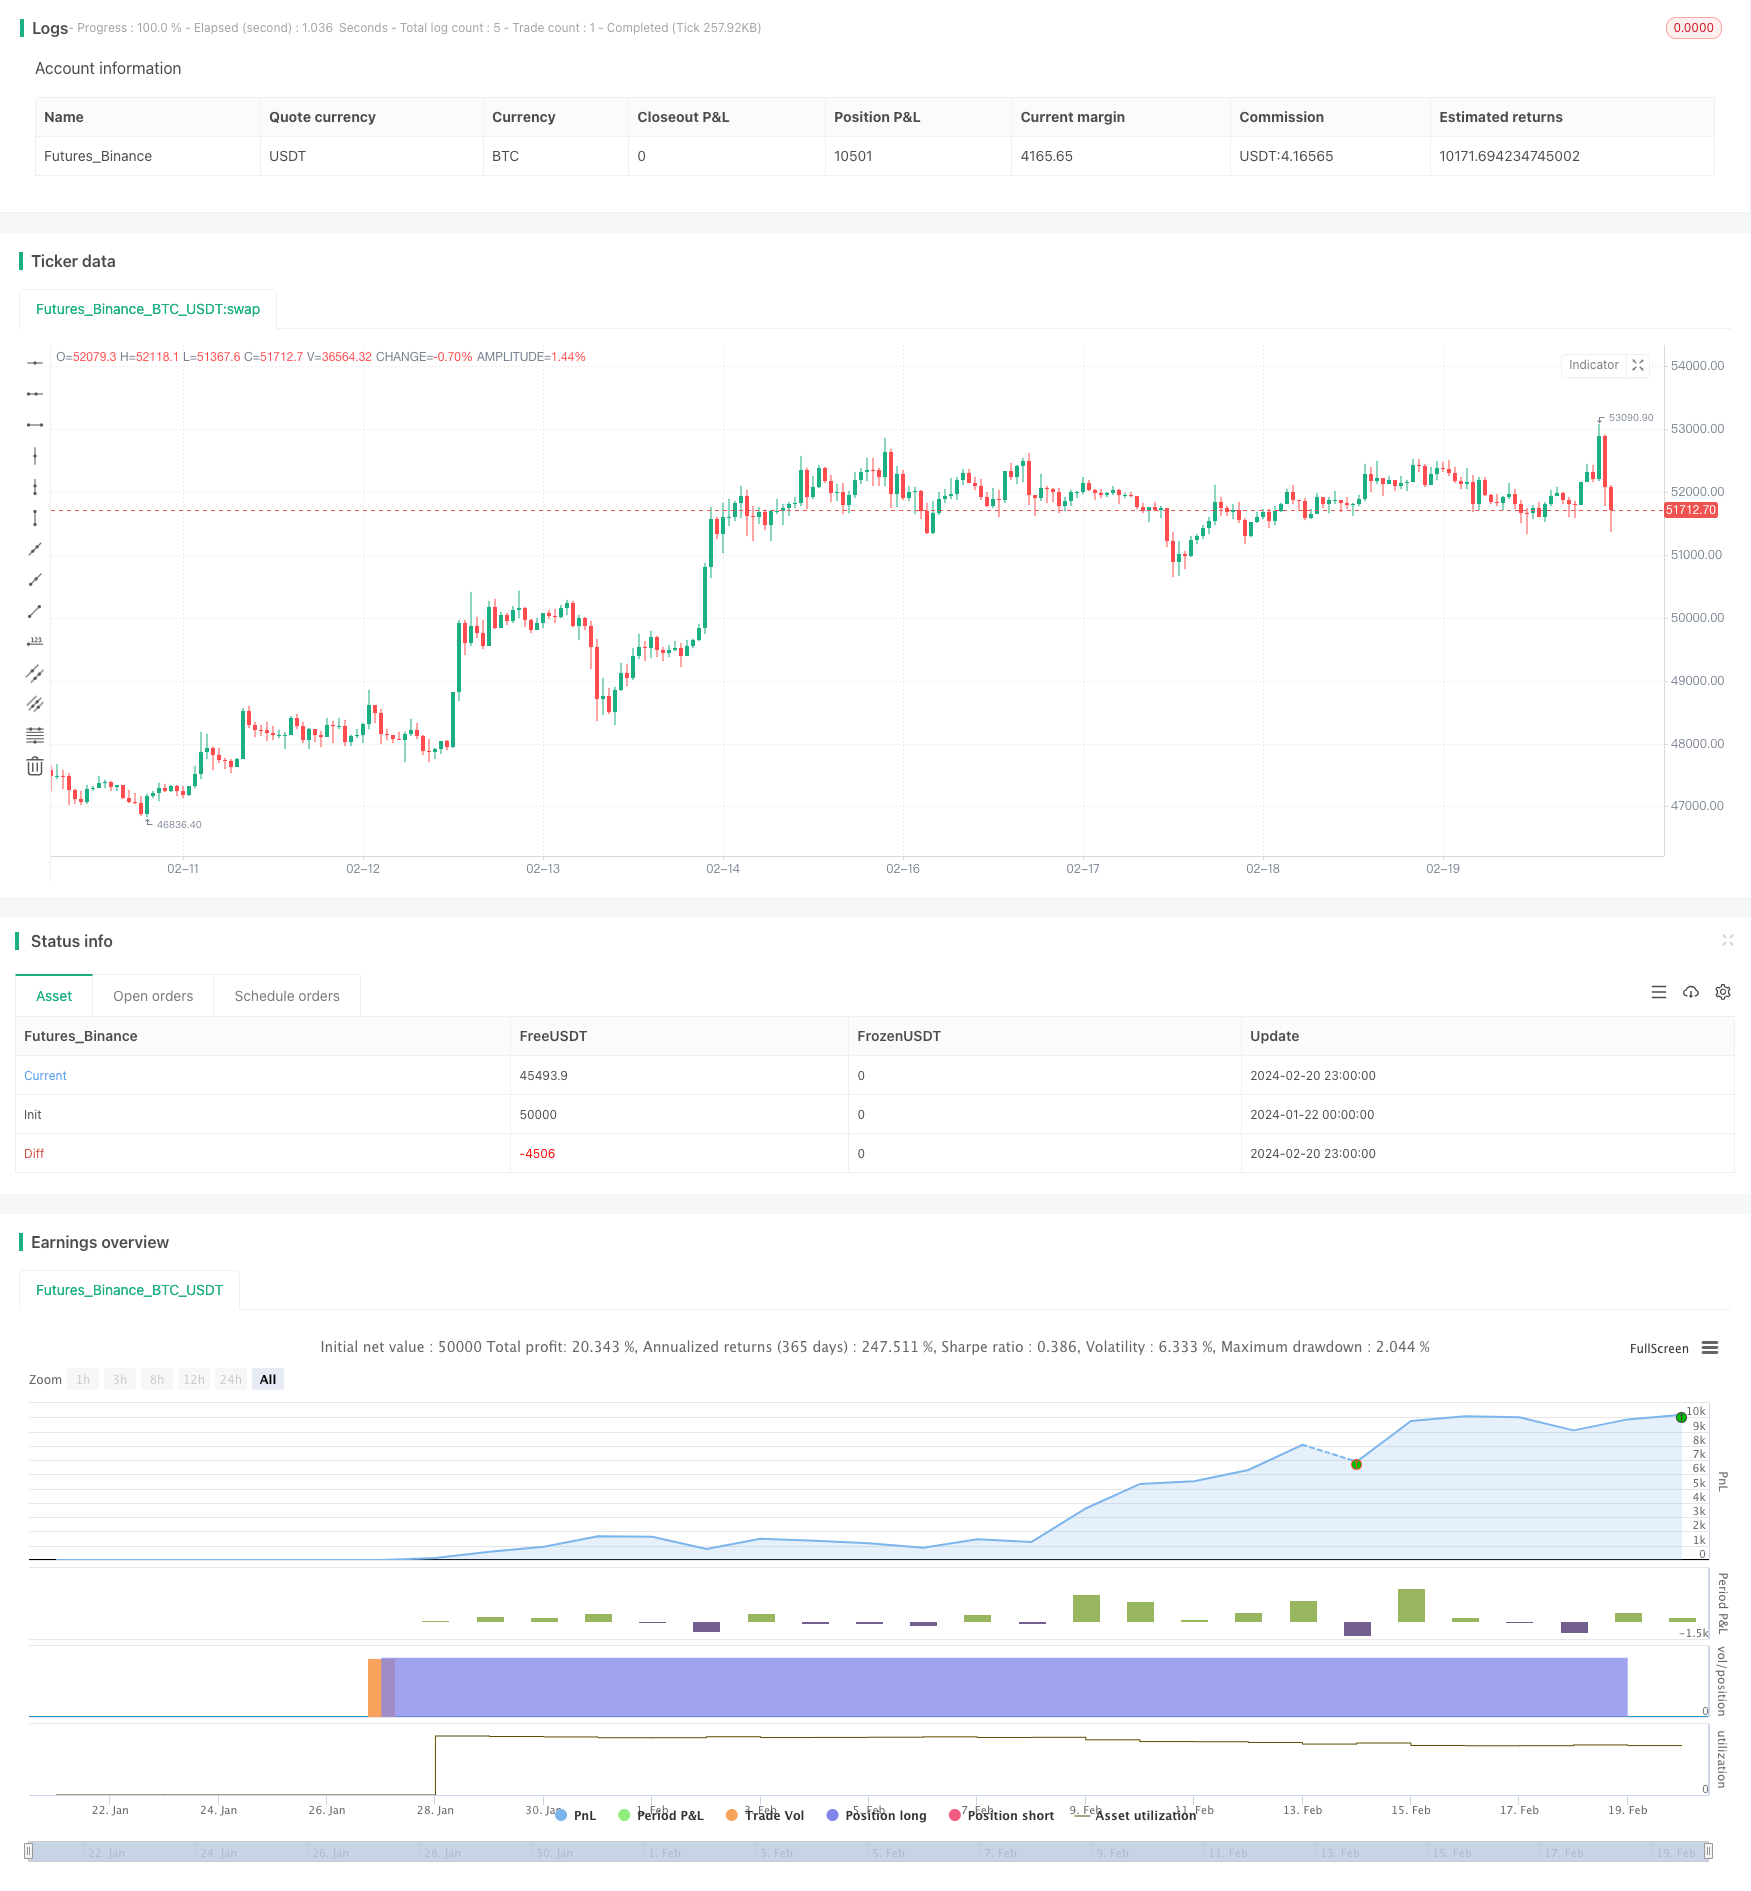
/*backtest
start: 2024-01-22 00:00:00
end: 2024-02-21 00:00:00
period: 1h
basePeriod: 15m
exchanges: [{"eid":"Futures_Binance","currency":"BTC_USDT"}]
*/

// This source code is subject to the terms of the Mozilla Public License 2.0 at https://mozilla.org/MPL/2.0/
// © SoftKill21
//@version=4
strategy("Crypto ZigZag RSI strategy 15min",overlay=true)
length =input(5, title="RSI Length")
overSold = input(25)
overBought= input(75)

p =close

vrsi = rsi(p, length)
var bool long = na
var bool short = na

long :=crossover(vrsi,overSold)
short := crossunder(vrsi,overBought)

var float last_open_long = na
var float last_open_short = na

last_open_long := long ? close : nz(last_open_long[1])
last_open_short := short ? close : nz(last_open_short[1])


entry_value =last_open_long
entry_value1=last_open_short

//
ZZPercent = input(1, title="Minimum % Change", type=input.float)
r1Level=entry_value
s1Level=entry_value1
trend = 0
trend := na(trend[1]) ? 1 : trend[1]
LL = 0.0
LL := na(LL[1]) ? s1Level : LL[1]
HH = 0.0
HH := na(HH[1]) ?r1Level : HH[1]

Pi = ZZPercent * 0.01
zigzag = float(na)

if trend > 0
    if r1Level >= HH
        HH := r1Level
        HH
    else
        if s1Level < HH * (1 - Pi)
            zigzag :=r1Level[1]
            trend := -1
            LL := s1Level
            LL
else

    if s1Level <= LL
        LL := s1Level
        LL
    else
        if r1Level > LL * (1 + Pi)
            zigzag := s1Level[1]
            trend := 1
            HH := s1Level
            HH


shortc=crossunder(trend,0)
longc=crossover(trend,0)


longa =input(true)
shorta=input(false)

if(longa)
    strategy.entry("long",1,when=longc)
    strategy.close("long",when=shortc)
if(shorta)
    strategy.entry("short",0,when=shortc)
    strategy.close("long",when=longc)