概述
双EMA快慢线交叉策略(Dual EMA Crossover Strategy)是一个基于两条不同周期的EMA均线交叉进行开仓和平仓的量化交易策略。该策略简单有效,容易理解,是量化交易的一种常用策略。
策略原理
该策略使用两条EMA均线,一条为25周期的EMA线,作为快线,一条为50周期的EMA线,作为慢线。当快线上穿慢线时,做多;当快线下穿慢线时,做空。
做多之后,设置止盈为入场价格的2%,止损为入场价格的2%,当价格达到止盈或止损后,平掉仓位。做空同理。
该策略的核心就是利用EMA快慢线的交叉来判断市场趋势和反转。上穿时判断为牛市并做多,下穿时判断为熊市并做空。止盈止损设置来锁定利润和控制风险。
优势分析
双EMA快慢线交叉策略具有以下优势:
- 思路清晰,逻辑简单,容易理解实施。
- 快线和慢线配合使用,可以抓住中短线趋势。
- 可以顺势而为,及时抓住市场转折点。
- 风险控制到位,止盈止损设置合理。
总的来说,该策略通过清晰的逻辑判断市场,运用EMA本身的优点,在风险可控的前提下,获取不错的中短线收益。
风险分析
双EMA快慢线交叉策略也存在一些风险:
- 市场出现剧烈波动时,EMA线交叉信号可能不准确,存在其误判的概率。
- 止盈止损点设置不合理时,可能错过更大的行情或承担更大的亏损。
- 交易费用和滑点的影响也不能忽略。
这些风险都可通过以下方式得到优化解决:
- 结合其他指标判断市场,避免EMA交叉的误判信号。
- 测试并优化止盈止损的设置点,在收益和风险之间找到平衡。
- 选择手续费低廉的交易平台,适当放大交易量。
优化方向
该策略还具有以下主要的优化方向:
- 优化EMA的周期参数,寻找最佳参数组合。
- 增加其他指标判断,形成交易组合,提高准确率。
- 动态调整止盈止损点。当亏损达到一定幅度时止损点跟踪放大,当盈利达到一定幅度止盈点移动等。
- 区分多头和空头市场,做定向交易。
这些优化都可以在保持策略简单清晰的基础上,提升收益率和胜率。
总结
双EMA快慢线交叉策略总的来说是一种非常实用的量化交易策略。它易于理解和实现,有效把握市场趋势。同时也具有一定的优化空间,通过参数调整和组合可以进一步提高收益率。这种简单直接的策略思路值得投资者学习和运用。
策略源码
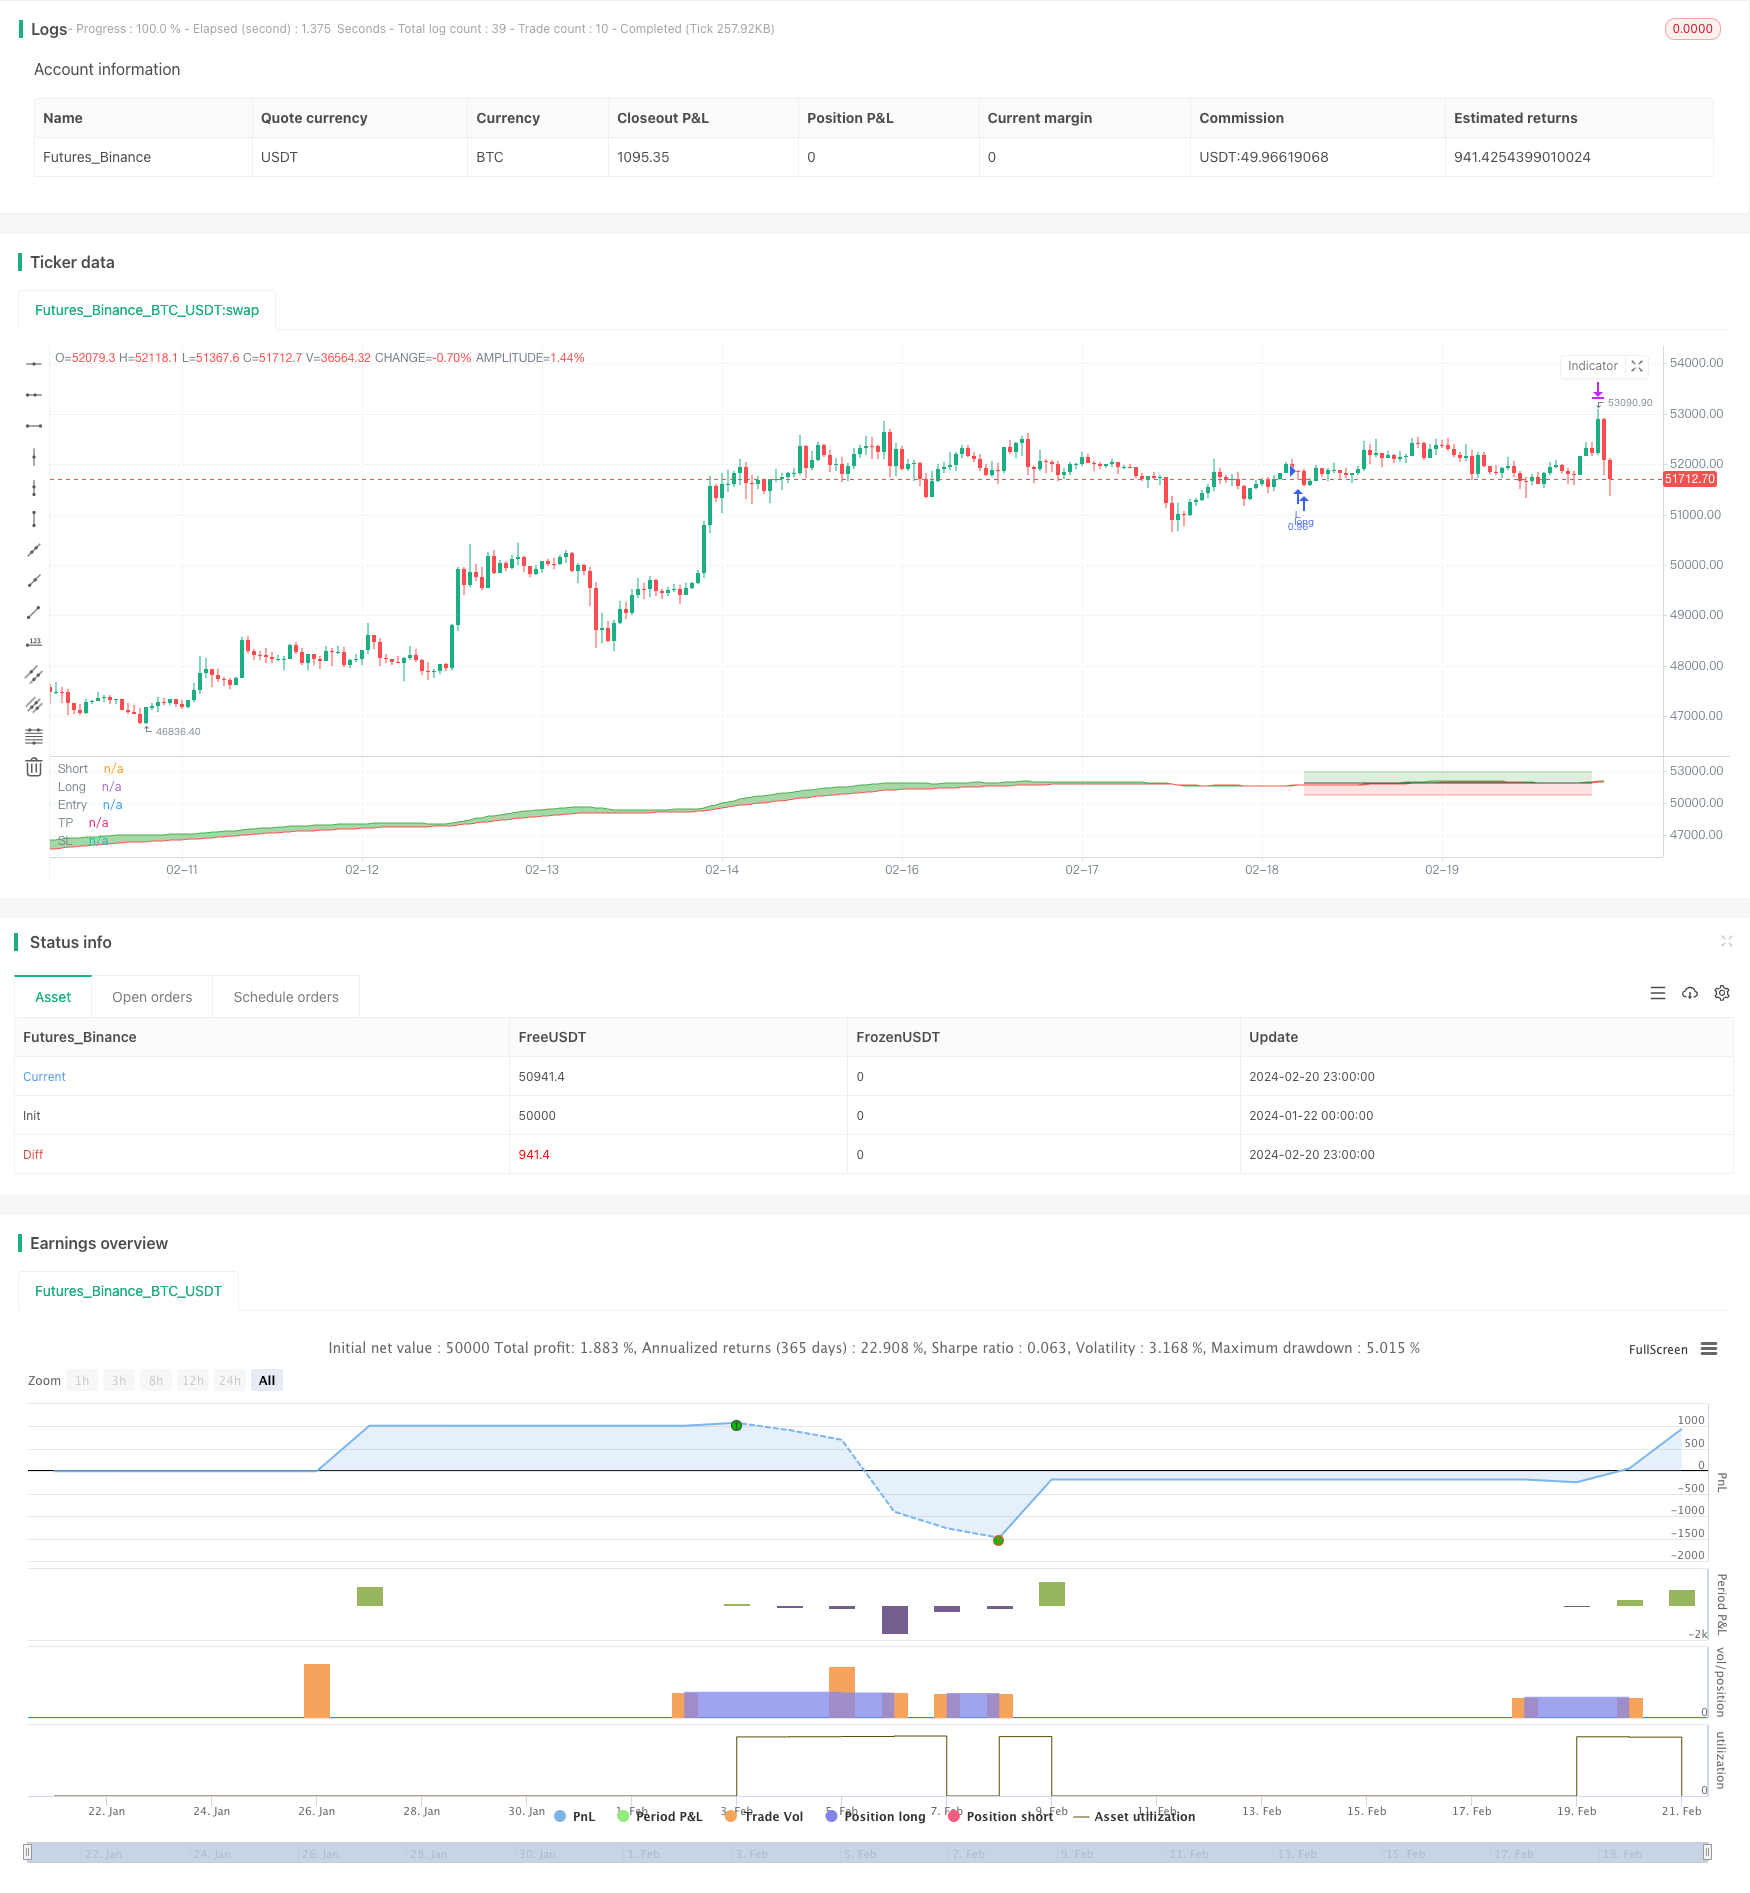
/*backtest
start: 2024-01-22 00:00:00
end: 2024-02-21 00:00:00
period: 1h
basePeriod: 15m
exchanges: [{"eid":"Futures_Binance","currency":"BTC_USDT"}]
*/

// SEMA-X(SEMA CROSS) [AB] : Simple EMA cross strategy Alert & Backtest
// 1. 2 EMA cross
// 2. Next candle entry
// 3. TP & SL

//@version=5
strategy("SEMA-X", "SEMA-X", overlay=false, margin_long=1,
 initial_capital=1000000, default_qty_type=strategy.percent_of_equity, default_qty_value=100,
 commission_type=strategy.commission.percent, commission_value=0.075, slippage=3)

//****************************************************************************//
// Input
//****************************************************************************//
// EMA length
emaLen25 = input.int(25, "Short", minval=1, confirm=true, group="[EMA]----------", inline="1")
emaLen50 = input.int(50, "Long",  minval=1, confirm=true, group="[EMA]----------", inline="1")

// TP & SL
isLong   = input.bool(true, "Long - ",    confirm=true, group="[TP & SL(%)]----------", inline="1")
tpLong   = input.float(2, "TP", minval=0, confirm=true, group="[TP & SL(%)]----------", inline="1")*0.01
slLong   = input.float(2, "SL", minval=0, confirm=true, group="[TP & SL(%)]----------", inline="1")*0.01
isShort  = input.bool(false, "Short - ",  confirm=true, group="[TP & SL(%)]----------", inline="2")
tpShort  = input.float(2, "TP", minval=0, confirm=true, group="[TP & SL(%)]----------", inline="2")*0.01
slShort  = input.float(2, "SL", minval=0, confirm=true, group="[TP & SL(%)]----------", inline="2")*0.01

// Backtest period
sTime = input(timestamp("0001-01-01"), "Start", group="[Backtest]----------")
eTime = input(timestamp("9999-01-01"), "End",   group="[Backtest]----------")
inDateRange   = true
periodBg      = input.bool(false, "Backtest BGcolor", confirm=true, group="[Backtest]----------", inline="1")
bgLong        = input.bool(false, "Position BGcolor", confirm=true, group="[Backtest]----------", inline="1")
periodBgColor = periodBg and inDateRange ? color.new(color.green, 95) : na
bgcolor(periodBgColor, title="Backtest BGcolor")
bgColorLong   = bgLong and strategy.position_size>0 ? color.new(color.green, 95) : na
bgcolor(bgColorLong, title="Position BGcolor")

// IRISBOT
exchange = input.string("binance",  "Exchange", confirm=true, group="[IRISBOT]----------", inline="2", options=["binance", "bybit", "upbit"])
account  = input.string("account1", "Account",  confirm=true, group="[IRISBOT]----------", inline="2")
symbol   = input.string("BTC/USDT", "Symbol",   confirm=true, group="[IRISBOT]----------", inline="3")
strategy = input.string("sema-x",   "Strategy", confirm=true, group="[IRISBOT]----------", inline="3")
token    = input.string("token",    "Token",    confirm=true, group="[IRISBOT]----------", inline="4")
stRatio  = input.float(100.0,       "Ratio(%)", confirm=true, group="[IRISBOT]----------", inline="5", tooltip="하나의 거래소에서 이 전략을 몇 % 비중으로 투자할 것인가?") * 0.01
leverage = input.float(1,           "Leverage", confirm=true, group="[IRISBOT]----------", inline="5")
isPlotMsg = input.bool(false, "View alert msg", confirm=true, group="[IRISBOT]----------", inline="6")

//****************************************************************************//
// Process
//****************************************************************************//
ema25=ta.ema(close, emaLen25)
ema50=ta.ema(close, emaLen50)

// Entry condition
longCondition  = isLong and ta.crossover(ema25, ema50)
shortCondition = isShort and ta.crossunder(ema25, ema50)

// Entry price
var price=0.0
var pricePlot=0.0
if (longCondition or shortCondition) and strategy.position_size == 0
    price:=close
pricePlot:=price
if (strategy.position_size==0)
    pricePlot:=na

// Amount
amount = str.tostring(stRatio*100)

// IRISBOT alert msg (for auto trading, you can change this for autoview, tvextbot, thanksbot, etc webhookbot)
msgLong  = '{"exchange":"'+exchange+'","account":"'+account+'","strategy":"'+strategy+'","symbol":"'+symbol+'","type":"market","side":"buy","amount":"'+amount+'%","leverage":"'+str.tostring(leverage)+'","token":"'+token+'"}'
msgShort = '{"exchange":"'+exchange+'","account":"'+account+'","strategy":"'+strategy+'","symbol":"'+symbol+'","type":"market","side":"sell","amount":"'+amount+'%","leverage":"'+str.tostring(leverage)+'","token":"'+token+'"}'
msgExit  = '{"exchange":"'+exchange+'","account":"'+account+'","strategy":"'+strategy+'","symbol":"'+symbol+'","type":"market","side":"close","token":"'+token+'"}'

// Entry signal
if inDateRange
    strategy.entry("L", strategy.long,  when=longCondition,  comment="L", alert_message=msgLong)
    strategy.entry("S", strategy.short, when=shortCondition, comment="S", alert_message=msgShort)
    strategy.exit("XL", "L", profit=price*tpLong/syminfo.mintick,  loss=price*slLong/syminfo.mintick,  comment="X", alert_message=msgExit)
    strategy.exit("XS", "S", profit=price*tpShort/syminfo.mintick, loss=price*slShort/syminfo.mintick, comment="X", alert_message=msgExit)

//****************************************************************************//
// Plot
//****************************************************************************//
// Alert msg plot
var msgTable = table.new(position = position.bottom_right, columns = 2, rows = 3, bgcolor = color.new(color.blue, 80), border_width = 1)
if isPlotMsg
    if isLong
        table.cell(msgTable, 0, 0, "Long",  text_halign = text.align_left)
        table.cell(msgTable, 1, 0, msgLong,  text_halign = text.align_left)

    if isShort
        table.cell(msgTable, 0, 1, "Short", text_halign = text.align_left, bgcolor=color.new(color.red, 80))
        table.cell(msgTable, 1, 1, msgShort, text_halign = text.align_left, bgcolor=color.new(color.red, 80))

    if isLong or isShort
        table.cell(msgTable, 0, 2, "Exit",  text_halign = text.align_left, bgcolor=color.new(color.purple, 80))
        table.cell(msgTable, 1, 2, msgExit,  text_halign = text.align_left, bgcolor=color.new(color.purple, 80))

// EMA
e0=plot(ema25, "Short", color.green)
e1=plot(ema50, "Long", color.red)
fill(e0, e1, ema25>ema50 ? color.new(color.green, 50) : color.new(color.red, 50), "EMA BG")

// TP & SL
p0=plot(pricePlot, "Entry", color.black, style=plot.style_linebr)
p1=plot(pricePlot*(strategy.position_size>0 ? 1+tpLong : 1-tpShort), "TP", color.new(color.green, 50), style=plot.style_linebr)
p2=plot(pricePlot*(strategy.position_size>0 ? 1-slLong : 1+slShort), "SL", color.new(color.red, 50), style=plot.style_linebr)
fill(p0, p1, color.new(color.green, 80), "TP BG")
fill(p0, p2, color.new(color.red, 80), "SL BG")