概述
均线交易策略通过计算快速移动平均线(50日线)和慢速移动平均线(200日线)来识别股票价格的上涨和下跌趋势,以捕捉潜在的交易机会。当快速移动平均线上穿慢速移动平均线时,表示股价上涨趋势形成,策略将建立多头仓位;当快速移动平均线下穿慢速移动平均线时,表示股价下跌趋势形成,策略将建立空头仓位。
策略原理
该策略的核心逻辑基于移动平均线的黄金交叉和死亡交叉来判断价格趋势。具体来说,如果50日移动平均线上穿200日移动平均线,称为“黄金交叉”,表示涨势来临;如果50日移动平均线下穿200日移动平均线,称为“死亡交叉”,表示跌势来临。策略会在黄金交叉时做多,在死亡交叉时做空,通过及时捕捉价格转折点来获利。
代码中,首先计算快速移动平均线(50日线)和慢速移动平均线(200日线),然后判断两条平均线的关系,如果快速移动平均线大于慢速移动平均线(黄金交叉),表示股价处于上涨趋势,这时策略将建立多头仓位;反之,如果快速移动平均线小于慢速移动平均线(死亡交叉),表示股价下跌趋势形成,策略将建立空头仓位。
策略优势分析
该策略具有以下优势:
- 规则简单清晰,容易理解和实现
- 移动平均线指标成熟且可靠,应用广泛
- 可有效过滤市场噪音,识别价格趋势
- 具有较高的胜率
- 可自定义移动平均线参数,适应不同市场环境
总的来说,该策略利用移动平均线指标的优势,设置合理的参数,形成了一套稳定的趋势跟踪策略,在牛市中跟踪上涨趋势获利,在熊市中捕捉下跌做空获利,是一种相对简单实用的量化策略。
风险及解决方法分析
该策略也存在一些风险,主要集中在以下几个方面:
whipsaw效应。当价格在平均线附近震荡时,可能出现多次错误信号。可以通过优化移动平均线参数减少whipsaw。
错过转折点。移动平均线存在滞后性,可能错过价格快速反转的关键转折点。可以结合其他指标如MACD等辅助判断。
不适合剧烈行情。在价格剧烈波动的行情中,移动平均线交叉信号可能效果不佳。这时可以考虑暂停策略,或结合波动率指标避让这类极端行情。
参数可优化空间有限。移动平均线参数优化空间比较小,需要人工经验结合优化。
优化方向
该策略可从以下几个方面进行进一步优化:
结合其他指标判断,形成指标组合,提高策略效果。例如加入MACD,波动率指标等。
优化移动平均线参数,降低误差。可以测试不同周期参数的移动平均线。
加入止损逻辑,控制风险。例如设定百分比止损或动态跟踪止损。
结合机器学习模型动态优化参数。可以建立模型自动优化参数以适应行情变化。
分层入场,平均开仓成本。可以分批建仓而不是一次性全仓入场。
总结
本策略整体来说是一个稳定、实用、容易实现的量化策略。它利用成熟的移动平均线指标判断价格趋势,在趋势发生转折时打开仓位捕捉利润。策略优势在于简单、稳定、胜率较高,适合作为量化交易的基础策略。当然也存在一些改进空间,投资者可以根据自身需要对该策略进行适当优化,使策略效果更好。
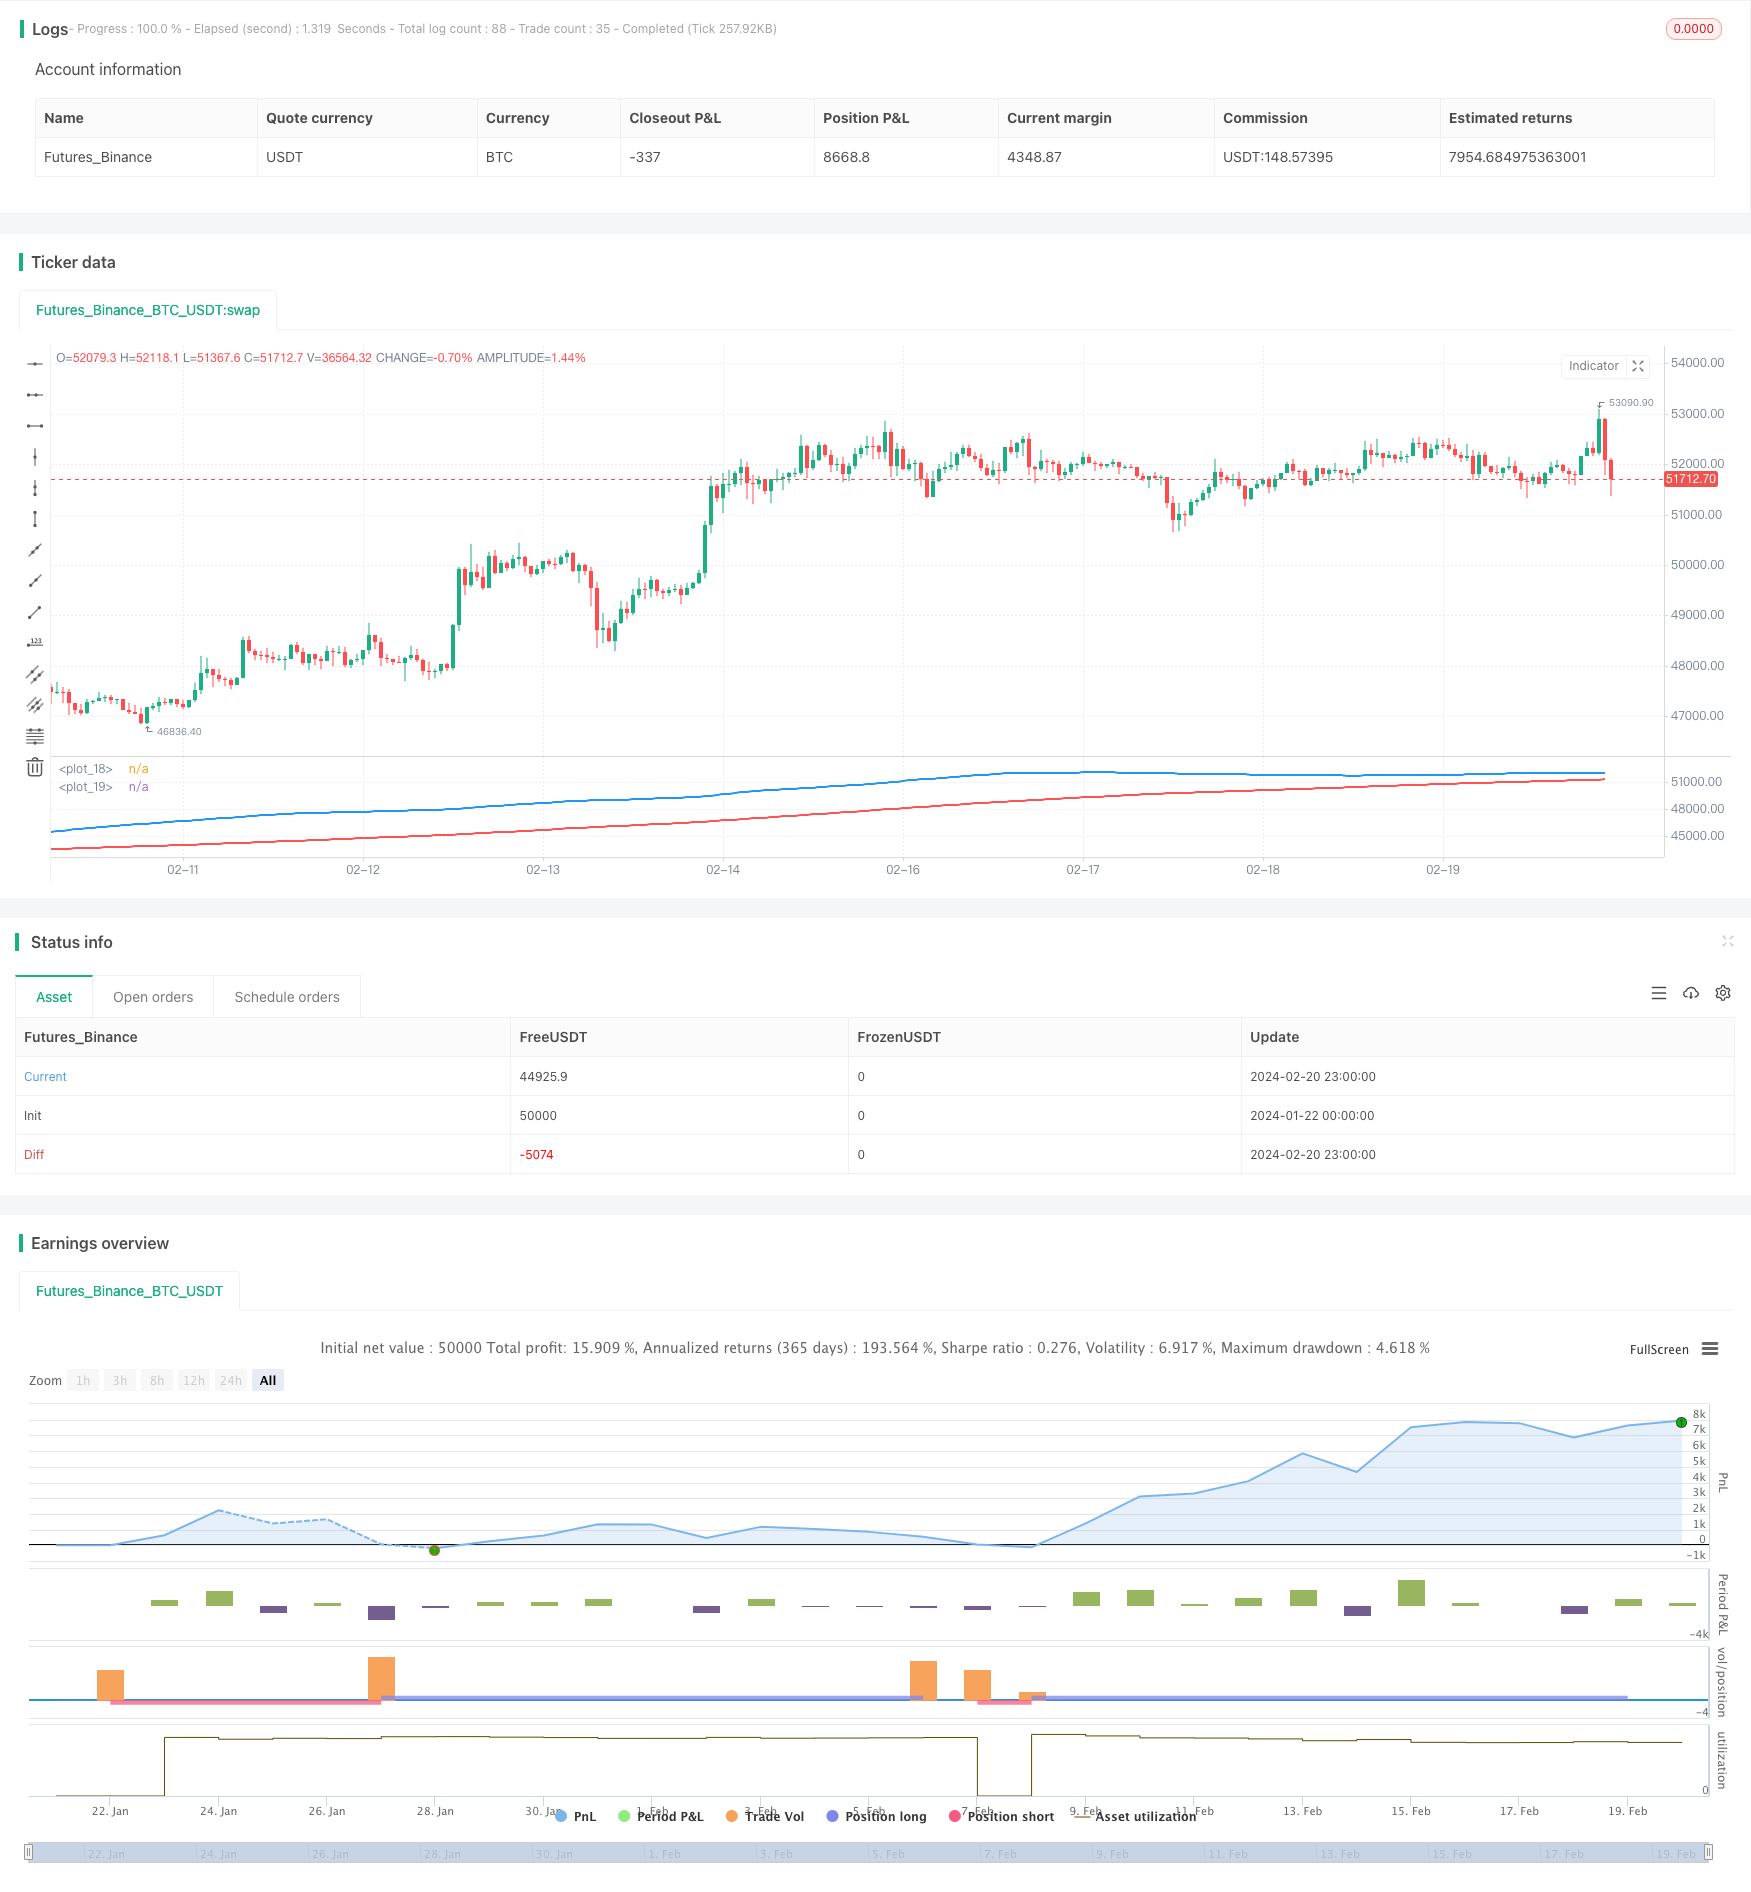
/*backtest
start: 2024-01-22 00:00:00
end: 2024-02-21 00:00:00
period: 1h
basePeriod: 15m
exchanges: [{"eid":"Futures_Binance","currency":"BTC_USDT"}]
*/

// This Pine Script™ code is subject to the terms of the Mozilla Public License 2.0 at https://mozilla.org/MPL/2.0/
// © pablobm0933

//@version=5
strategy("Estrategia de Trading")

// Definir medias móviles para identificar tendencias
fast_ma = ta.sma(close, 50) // Media móvil rápida
slow_ma = ta.sma(close, 200) // Media móvil lenta

// Condiciones para identificar tendencia alcista
tendencia_alcista = fast_ma > slow_ma

// Condiciones para identificar tendencia bajista
tendencia_bajista = fast_ma < slow_ma

// Dibujar las medias móviles en el gráfico
plot(fast_ma, color=color.blue, linewidth=2)
plot(slow_ma, color=color.red, linewidth=2)

// Detectar señales de entrada y salida
if (tendencia_alcista)
    strategy.entry("Compra", strategy.long)
    strategy.exit("Venta", "Compra", loss=close*0.02) // Salida de la posición con una pérdida del 2%

if (tendencia_bajista)
    strategy.entry("Venta", strategy.short)
    strategy.exit("Compra", "Venta", loss=close*0.02) // Salida de la posición con una pérdida del 2%