概述
该策略通过计算最近一定周期内的成交量的最高值和最低值,形成一个自适应的波动范围,当当前周期的成交量突破この范围时产生交易信号。信号方向根据阴阳烛判断,属于简单有效的追踪市场突发性大单的策略。
策略原理
核心逻辑是计算最近N周期内的正负成交量的最高最低值,形成一个自适应波动范围。基于这个范围判断当期是否出现突破。同时综合阴阳线信号,完成判断。
具体计算流程是:
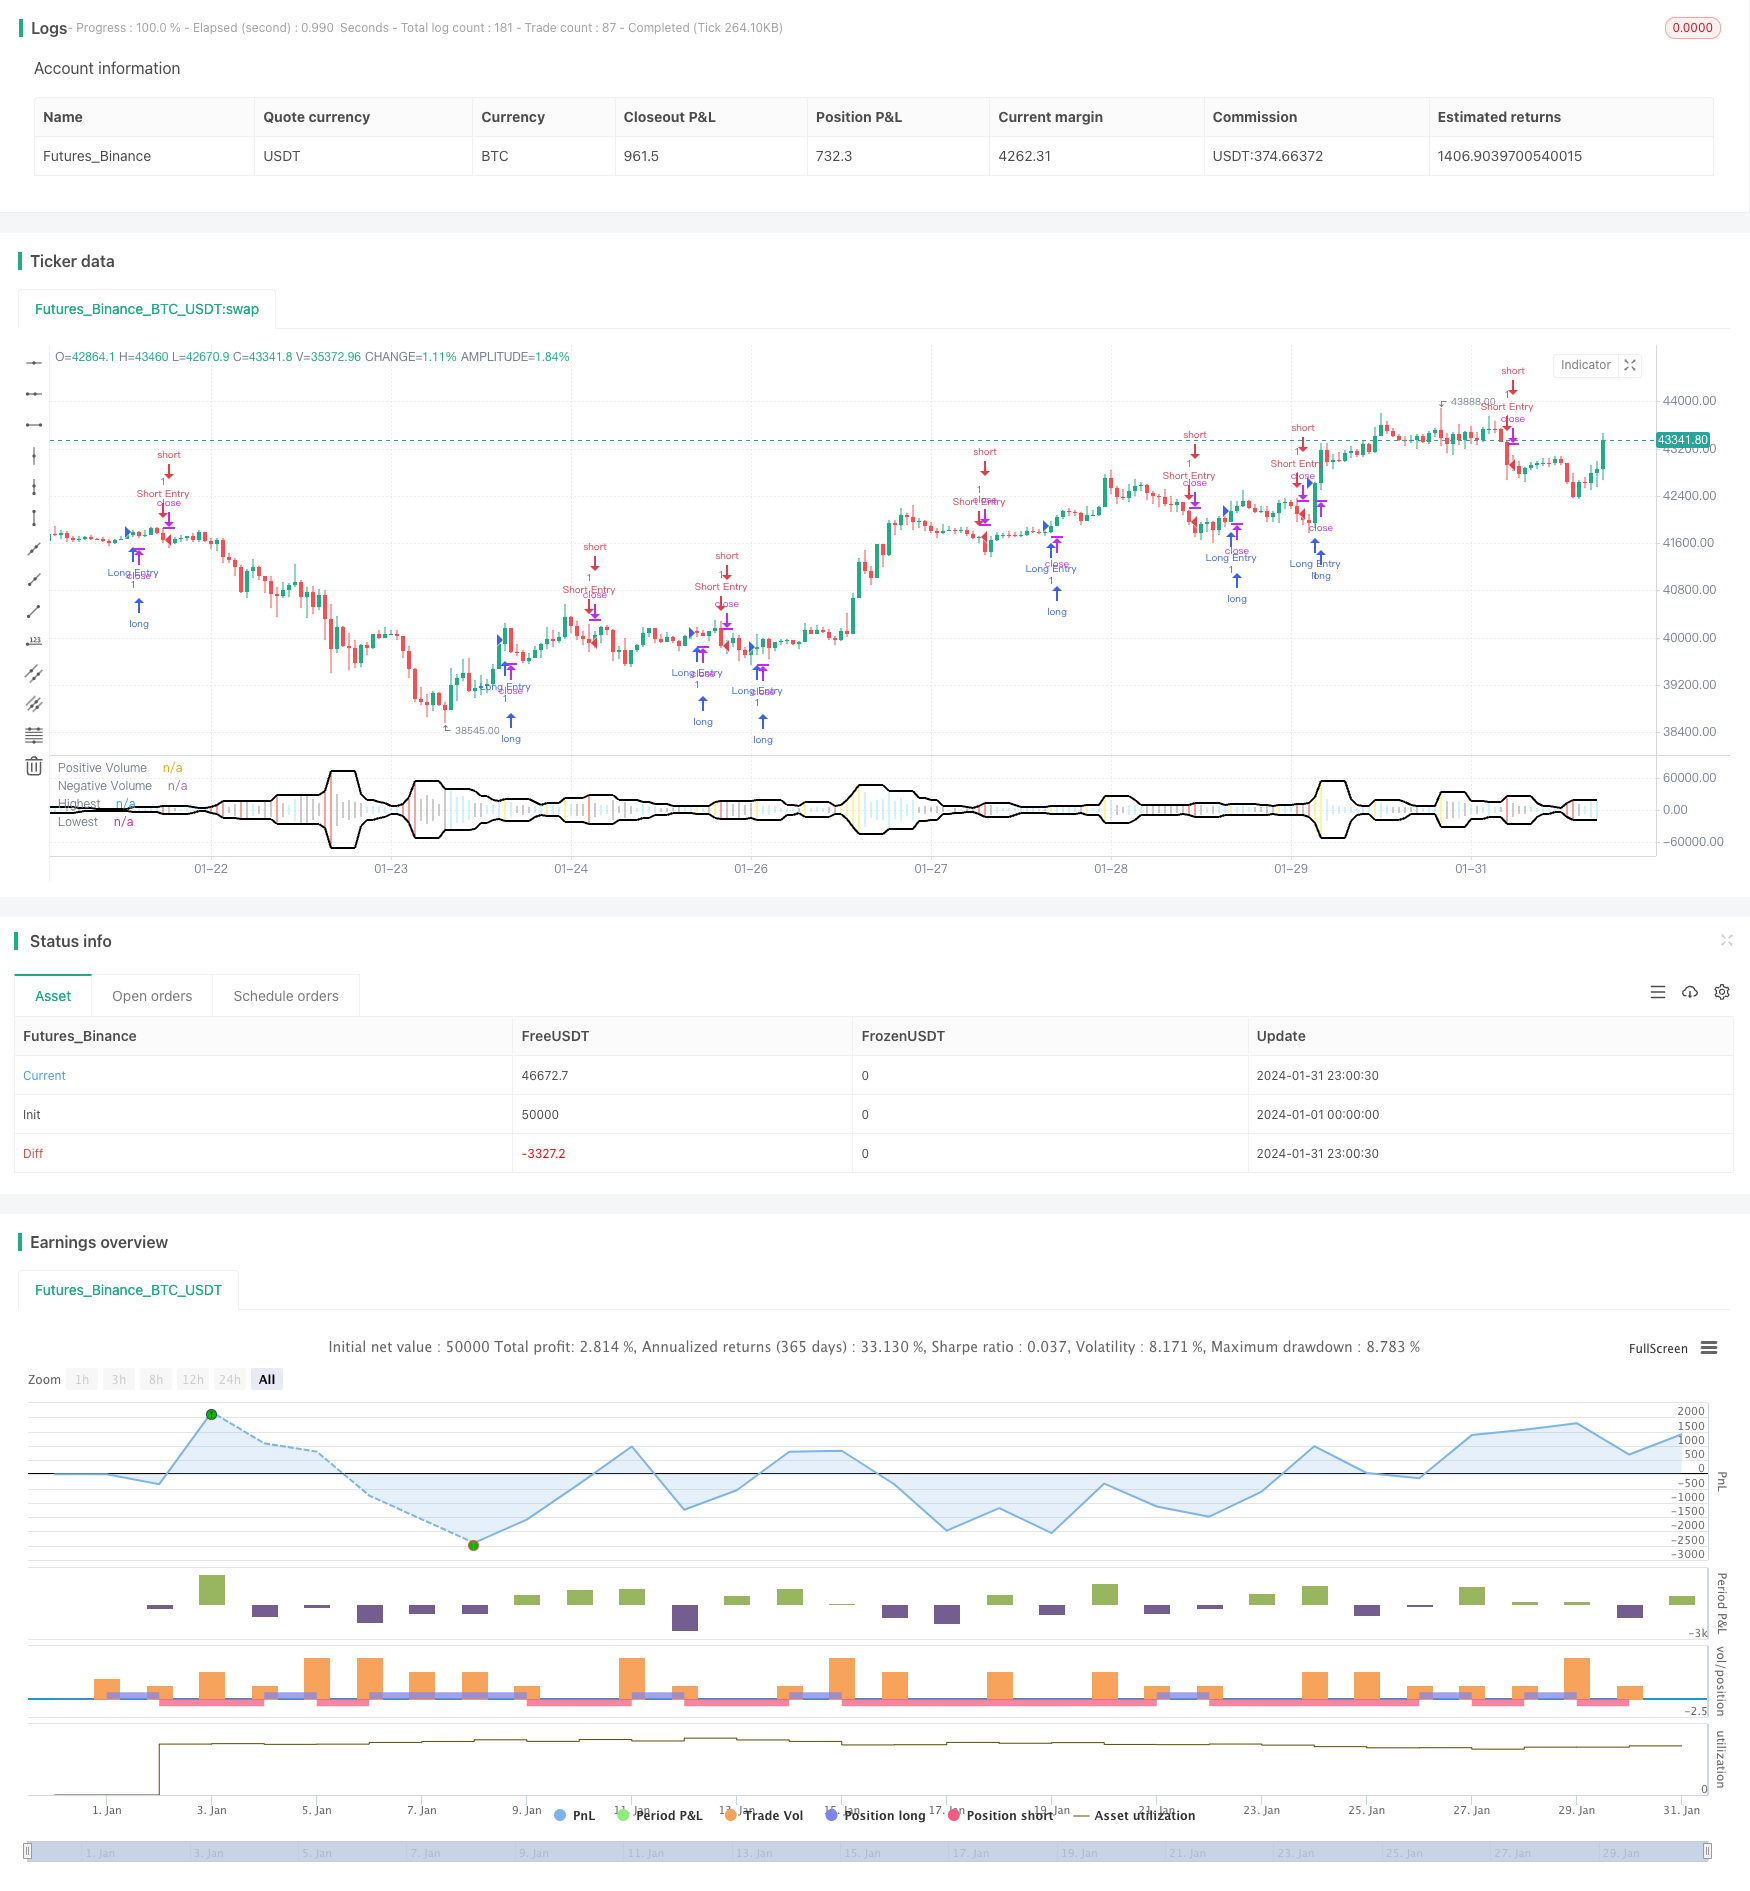
- 计算最近N周期的最高成交量Highest和最低成交量Lowest
- 判断当前周期的成交量Volume是否高于Highest
- 结合当前是阴线还是阳线,完成突破信号判断
- 产生做多做空信号
优势分析
该策略主要有以下优势:
- 自适应范围设定,对市场变化敏感
- 捕捉高波动突发行情,降低漏单率
- 结合烛形判断,避免假突破
- 实现简单,容易理解和修改
- 可灵活调整参数,适应不同品种
风险分析
该策略也存在一些风险:
- 容易追高杀跌,需要调整参数控制
- 大周期震荡市场中可能出现频繁错误信号
- 无法区分正常和异常突破,需要結合其他指标或模式判断
- 每次突破只有一次入场机会,不能追踪趋势
可以通过调整参数周期,结合其他指标过滤来优化。
优化方向
该策略可以从以下几个方向进行优化:
- 增加参数调整区间长度,适应不同市场周期
- 添加均线、布林带等指标,过滤信号
- 优化结合K线形态,避免假突破误入
- 增加再入场和止损模块,使策略可以追踪趋势
总结
该策略整体简单实用,通过自适应范围和量价合并判断,可有效捕捉突发性单边行情。但也存在一定的误报风险,需要适当调整参数并配合其他工具使用,方能发挥最大效果。
策略源码
/*backtest
start: 2024-01-01 00:00:00
end: 2024-01-31 23:59:59
period: 1h
basePeriod: 15m
exchanges: [{"eid":"Futures_Binance","currency":"BTC_USDT"}]
*/

// This source code is subject to the terms of the Mozilla Public License 2.0 at https://mozilla.org/MPL/2.0/
// © EvoCrypto

//@version=4
strategy("Ranged Volume Strategy - evo", shorttitle="Ranged Volume", format=format.volume)

// INPUTS {
Range_Length    =   input(5,        title="Range Length",                       minval=1)

Heikin_Ashi     =   input(true,     title="Heikin Ashi Colors")
Display_Bars    =   input(true,     title="Show Bar Colors")
Display_Break   =   input(true,     title="Show Break-Out")
Display_Range   =   input(true,     title="Show Range")
// }

// SETTINGS {
Close           =   Heikin_Ashi ? security(heikinashi(syminfo.tickerid), timeframe.period, close)    : close
Open            =   Heikin_Ashi ? security(heikinashi(syminfo.tickerid), timeframe.period, open)     : open

Positive        =    volume
Negative        =   -volume

Highest         =   highest(volume, Range_Length)
Lowest          =   lowest(-volume, Range_Length)

Up              =   Highest > Highest[1] and Close > Open
Dn              =   Highest > Highest[1] and Close < Open

Volume_Color    =
 Display_Break and Up   ? color.new(#ffeb3b, 0)     :
 Display_Break and Dn   ? color.new(#f44336, 0)     :
 Close > Open           ? color.new(#00c0ff, 60)    :
 Close < Open           ? color.new(#000000, 60)    : na
// }

//PLOTS {
plot(Positive,                      title="Positive Volume",    color=Volume_Color,             style=plot.style_histogram,  linewidth=4)
plot(Negative,                      title="Negative Volume",    color=Volume_Color,             style=plot.style_histogram,  linewidth=4)

plot(Display_Range ? Highest : na,  title="Highest",            color=color.new(#000000, 0),    style=plot.style_line,       linewidth=2)
plot(Display_Range ? Lowest  : na,  title="Lowest",             color=color.new(#000000, 0),    style=plot.style_line,       linewidth=2)

barcolor(Display_Bars ? Volume_Color : na)
// }

if (Up)
    strategy.entry("Long Entry", strategy.long)
if (Dn)
    strategy.entry("Short Entry", strategy.short)