概述
该策略通过计算不同周期的MA移动平均线,判断市场趋势方向,在趋势向上时做多,趋势向下时做空,实现趋势追踪。
策略原理
- 计算20周期、60周期和120周期的MA线
- 比较MA20、MA60和MA120的大小关系,判断目前的趋势方向
- 如果MA20>MA60>MA120,判断为趋势向上
- 如果MA20
- 在MA20上穿MA60时做多入市,在MA20下穿MA60时做空入市
- 以MA60作为止盈止损的参考线
- 多头止盈线为MA60的3倍
- 空头止盈线为MA60的0.9倍
优势分析
- 使用不同周期的MA组合判断趋势,避免whipsaws
- 只在趋势转折点入场,增加胜率
- 有清晰的止盈止损规则,降低风险
风险分析
- 在震荡行情中,MA线交叉可能频繁,造成过于频繁交易
- 止盈止损参数需要优化,否则可能过早止损或止盈不足
优化方向
- 增加判断震荡行情的指标,避免震荡市频繁交易
- 优化MA周期参数组合,找到最佳参数
- 测试并优化止盈止损系数,确保最大化收益和降低风险之间的平衡
总结
该策略整体思路清晰,使用MA判断趋势非常经典,在参数优化和指标优化后,可以成为一个非常实用的趋势追踪策略。
策略源码
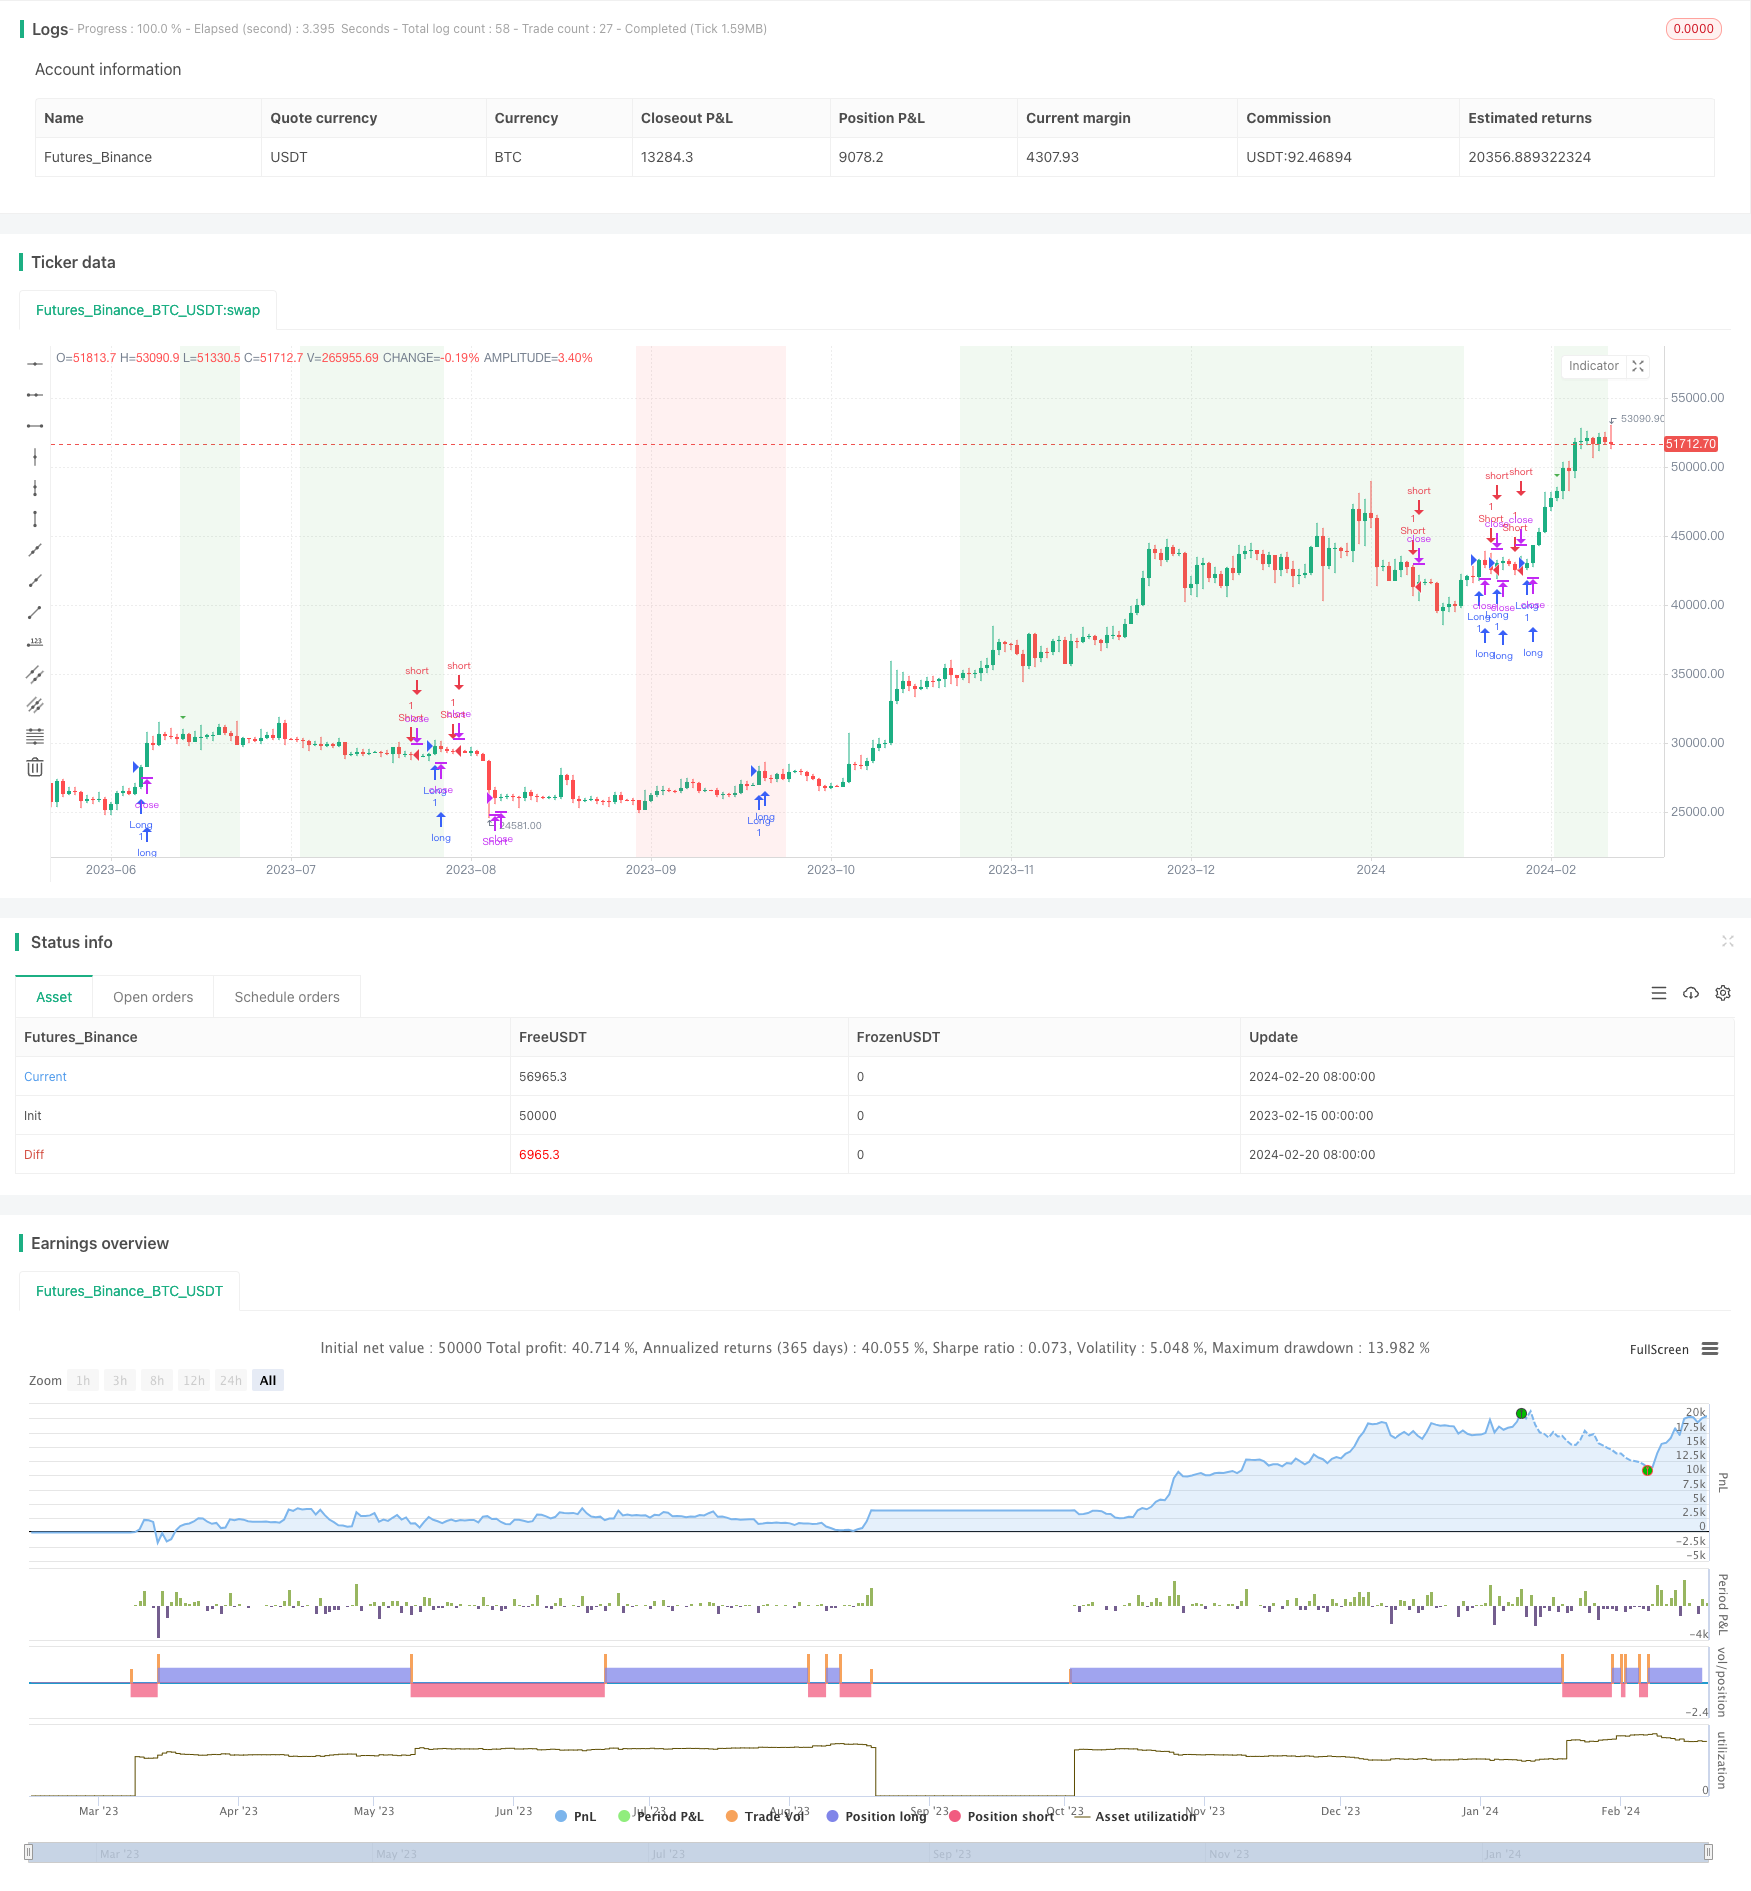
/*backtest
start: 2023-02-15 00:00:00
end: 2024-02-21 00:00:00
period: 1d
basePeriod: 1h
exchanges: [{"eid":"Futures_Binance","currency":"BTC_USDT"}]
*/

//@version=5
strategy("MA60上多下空", overlay=true)

// 计算MA20/60/120
ma20 = ta.sma(close, 20)
ma60 = ta.sma(close, 60)
ma120 = ta.sma(close, 120)

// 判断MA的趋势
maUpTrend = ma20 > ma60 and ma60 > ma120
maDownTrend = ma20 < ma60 and ma60 < ma120

// 画竖直线标记MA趋势转折点
plotshape(maUpTrend and ta.crossover(ma20, ma60), style=shape.triangledown, location=location.abovebar, color=color.green, size=size.small)
plotshape(maDownTrend and ta.crossunder(ma20, ma60), style=shape.triangleup, location=location.belowbar, color=color.red, size=size.small)

// 画背景标记MA趋势
bgcolor(maUpTrend ? color.new(color.green, 90) : na)
bgcolor(maDownTrend ? color.new(color.red, 90) : na)

// 建立多头仓位的条件
longCondition = ta.crossover(close, ma60)

// 建立空头仓位的条件
shortCondition = ta.crossunder(close, ma60)

// 在穿过MA60时,根据条件建立相应的多头或空头仓位
if (longCondition)
    strategy.entry("Long", strategy.long)

if (shortCondition)
    strategy.entry("Short", strategy.short)

// 止盈止损规则
calculateReturns() =>
    close / strategy.position_avg_price - 1

takeProfitCondition = calculateReturns() >= 3  // 仓位盈利达到300%
stopLossCondition = calculateReturns() <= -0.1  // 仓位亏损达到10%

if (takeProfitCondition)
    strategy.close("Long", comment="Take Profit")
    strategy.close("Short", comment="Take Profit")

if (stopLossCondition)
    strategy.close("Long", comment="Stop Loss")
    strategy.close("Short", comment="Stop Loss")