概述
该策略名为“基于价格与SMA交叉的量化交易策略”,主要通过计算不同周期的SMA,并跟踪价格与SMA的交叉情况来产生交易信号。当价格从下向上突破SMA时,产生买入信号;当价格从上向下跌破SMA时,产生卖出信号。
策略原理
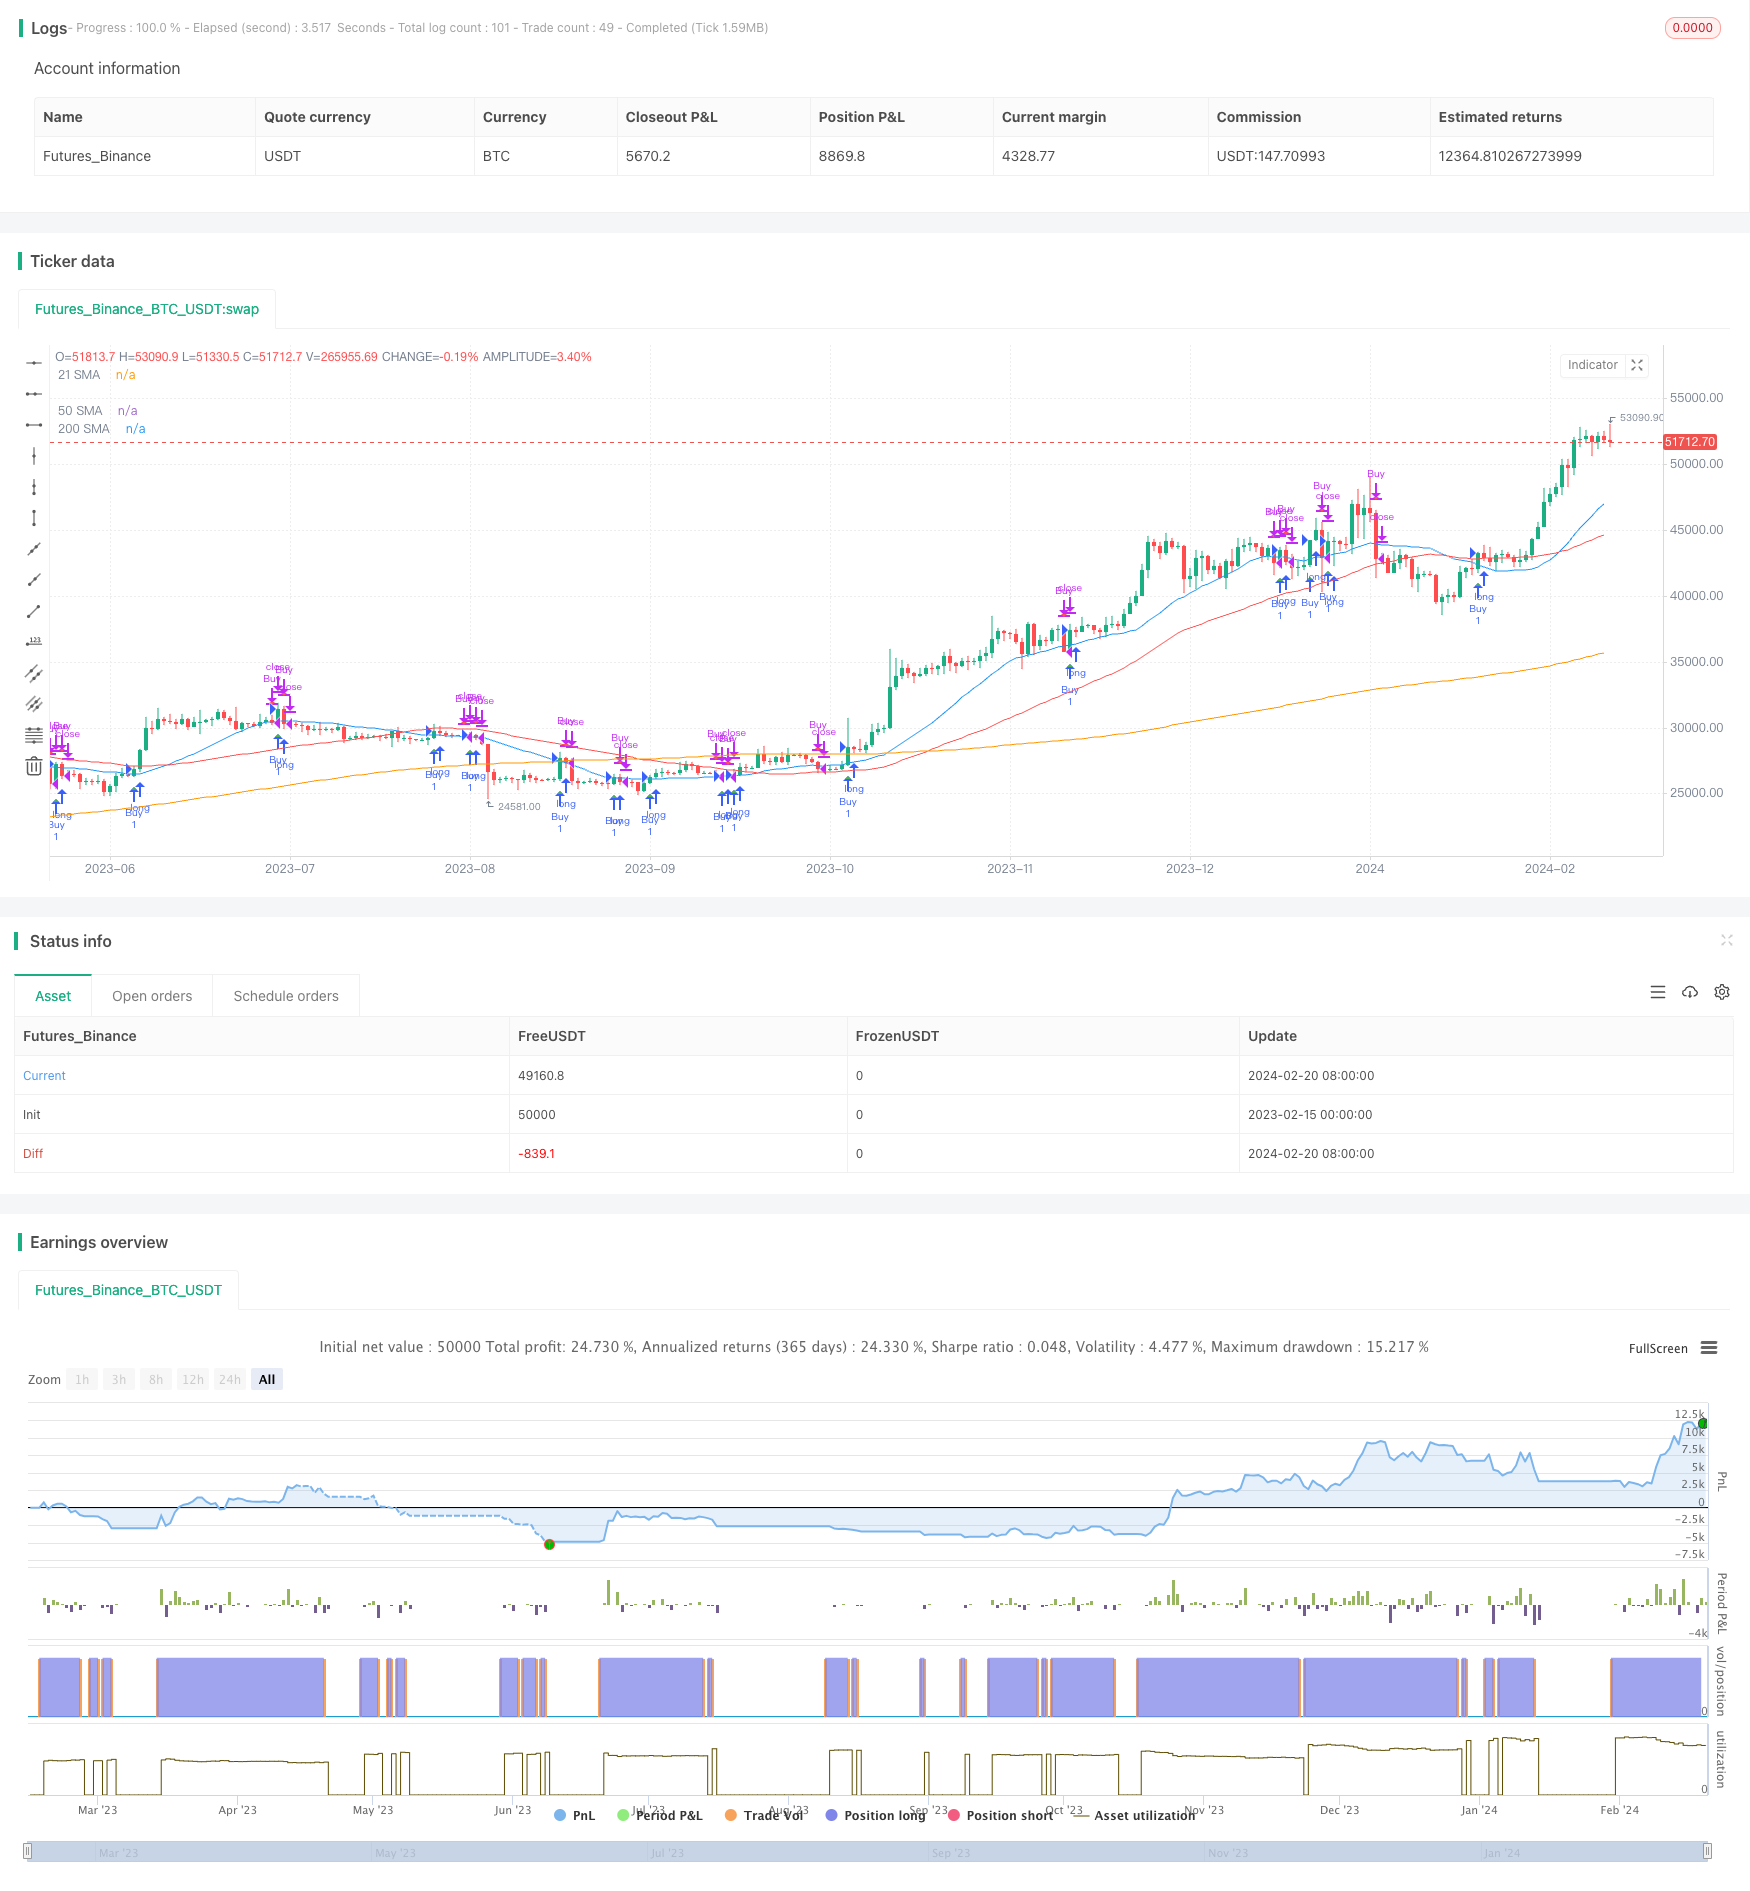
该策略的核心逻辑是跟踪价格与21日简单移动均线(SMA)的交叉情况。同时,策略还计算了50日SMA和200日SMA,这有助于判断大致趋势。
具体来说,策略会请求获取股票在指定日期范围内的收盘价,然后基于输入的SMA周期计算不同的SMA。如果价格从下向上突破21日SMA,就会设置买入信号;如果价格从上向下跌破21日SMA,就会设置卖出信号。
在计算SMA和判断交叉的同时,策略会跟踪当前的持仓情况。当买入信号触发时,策略会进入持仓;当卖出信号触发时,策略会平仓。通过这个方式,完成基于SMA交叉系统的自动交易。
优势分析
该策略最大的优势是简单易行,容易理解和实现。SMA是一种常用的技术分析指标,SMA交叉是常见的交易信号之一。这种基于指标交叉的策略,可以轻松地应用于不同的股票和时间范围,适合自动化交易。
另一个优势是该策略可以通过调整SMA参数进行优化。例如可以测试不同的SMA周期组合,寻找最佳参数,以适应特定股票的波动规律。此外,策略也可以通过添加其他指标来实现 확证和优化。
风险及解决方法
该策略最大的风险在于指标类策略会产生较多的错误信号。例如在盘整震荡期,价格可能频繁地上下穿越SMA,导致不必要的交易信号。
常见的解决方法包括设置止损,调整参数,或者添加过滤条件等。例如可以设置最大损失比例来限制风险;也可以调整SMA周期,选取更稳定的参数组合;或者添加其他指标的确认来过滤部分信号。
优化方向
该策略可以通过以下几个方向进行优化:
测试并选择最佳的SMA参数组合。可以回测不同的SMA长度,寻找最合适的周期。
增加其他指标FilterSignal confirmation,例如RSI,MACD等。这可以过滤掉一些错误信号。
添加止损逻辑。设置最大容忍损失或者移动止损可以控制风险。
优化入场时机。可以考虑在重要的突破点附近进入,而不是严格追踪SMA交叉。
测试复合策略。可以考虑与其他类型策略,例如趋势跟踪,组合使用。
总结
该策略通过简单的SMA指标交叉来实现自动化交易。优点是简单易行,容易理解;缺点是信号频繁,容易被套。我们可以通过参数优化、增加filter、止损等方式来改善策略效果。该策略为我们提供了一个基础框架,可以通过不断添加新的要素来丰富和提高策略。
/*backtest
start: 2023-02-15 00:00:00
end: 2024-02-21 00:00:00
period: 1d
basePeriod: 1h
exchanges: [{"eid":"Futures_Binance","currency":"BTC_USDT"}]
*/

//@version=5
strategy("Price Cross Above/Below SMA Strategy", shorttitle="Tressy Strat", overlay=true)

// Define start and end year inputs
start_year = input.int(2022, title="Start Year")
end_year = input.int(2022, title="End Year")

// Define start and end month inputs
start_month = input.int(1, title="Start Month", minval=1, maxval=12)
end_month = input.int(12, title="End Month", minval=1, maxval=12)

// Define SMA length inputs
sma_length = input.int(21, title="SMA Length")
sma_length_50 = input.int(50, title="50 SMA Length")
sma_length_200 = input.int(200, title="200 SMA Length")

// Filter data within the specified date range
filter_condition = true
filtered_close = request.security(syminfo.tickerid, "D", close[0], lookahead=barmerge.lookahead_on)

// Define SMAs using the input lengths
sma = ta.sma(filtered_close, sma_length)
sma_50 = ta.sma(filtered_close, sma_length_50)
sma_200 = ta.sma(filtered_close, sma_length_200)

// Initialize position
var bool in_position = false

// Condition for a price cross above SMA within the date range
cross_above = filter_condition and ta.crossover(filtered_close, sma)

// Condition for a price cross below SMA within the date range
cross_below = filter_condition and ta.crossunder(filtered_close, sma)

// Buy condition
if cross_above
    in_position := true

// Sell condition
if cross_below
    in_position := false

// Strategy entry and exit
if cross_above
    strategy.entry("Buy", strategy.long)
if cross_below
    strategy.close("Buy")

// Plot the SMAs on the chart
plot(sma, color=color.blue, title="21 SMA")
plot(sma_50, color=color.red, title="50 SMA")
plot(sma_200, color=color.orange, title="200 SMA")

// Plot the Buy and Sell signals with "tiny" size
plotshape(cross_above, style=shape.triangleup, location=location.belowbar, color=color.green, size=size.tiny, title="Buy Signal")
plotshape(cross_below, style=shape.triangledown, location=location.abovebar, color=color.red, size=size.tiny, title="Sell Signal")