概述
本策略是基于Andrew Abraham在1998年9月《交易技术分析师》杂志上发表的“跟踪趋势”文章中给出的思路进行改进设计的,用于动态跟踪股票价格趋势,并据此产生交易信号。
策略原理
该策略首先计算最近21天的平均真实波动范围作为参考阈值,然后计算最近21天内最高价和最低价,并据此设定通道上下限,通道上限为最近21天最高价减去平均真实波动范围的3倍,下限为最近21天最低价加上平均真实波动范围的3倍。当收盘价高于通道上限时,为抛压信号;当收盘价低于通道下限时,为吸筹信号。为过滤假信号,还计算了长度为21的指数移动平均线,只有当收盘价与通道限制同向突破移动平均线时,才生成真正的交易信号。另外,该策略还提供反转输入参数,可以将原始的做多做空信号进行反转,从而实现做空做多操作。
优势分析
该策略最大的优势在于可以动态跟踪价格趋势,据此产生交易信号。相比固定参数的移动平均线策略,能更好地捕捉价格变化趋势。此外,结合真实波动范围进行通道建立,避免了通道限制只根据最高价最低价设定带来的不足。通道上下限的波动范围也非常合理,在一定程度上避免了假突破。可以自定义反转参数也增加了策略的灵活性。
风险分析
该策略主要存在两个方面的风险:一是交易信号增多带来的过度交易风险;二是参数设置不当可能带来的风险。由于该策略采用动态参数,交易信号会比传统移动平均线策略更为频繁,可能带来一定程度的过度交易风险。此外,如果参数设置得不当,如时间周期设置过短或通道限制数值过小,也会增多假信号从而增加风险。
为控制风险,可以适当调整参数,选取较长的时间周期,并适当放宽通道上下限的约束。此外也可以考虑加入止损策略,以控制单笔损失。
优化方向
该策略的优化空间还比较大。例如可以考虑结合其他过滤指标,如RSI、KD等来避免假突破。也可以尝试通过机器学习方法来自动优化参数。此外,不同股票和市场环境下,参数的最优值也会有所不同。所以我们也可以考虑制定一套参数优选机制,根据股票和市场特征动态选择最优参数,从而提高策略稳定性。
总结
本策略整体来说是一个非常实用的趋势跟踪策略。相比传统移动平均线策略,它更加灵活和智能,能够动态捕捉价格变化趋势。在参数调整得当的情况下,其交易信号质量较高,可以获得不错的回报。后续通过进一步优化,预计该策略的表现还可持续改进。值得实盘检验和投入应用。
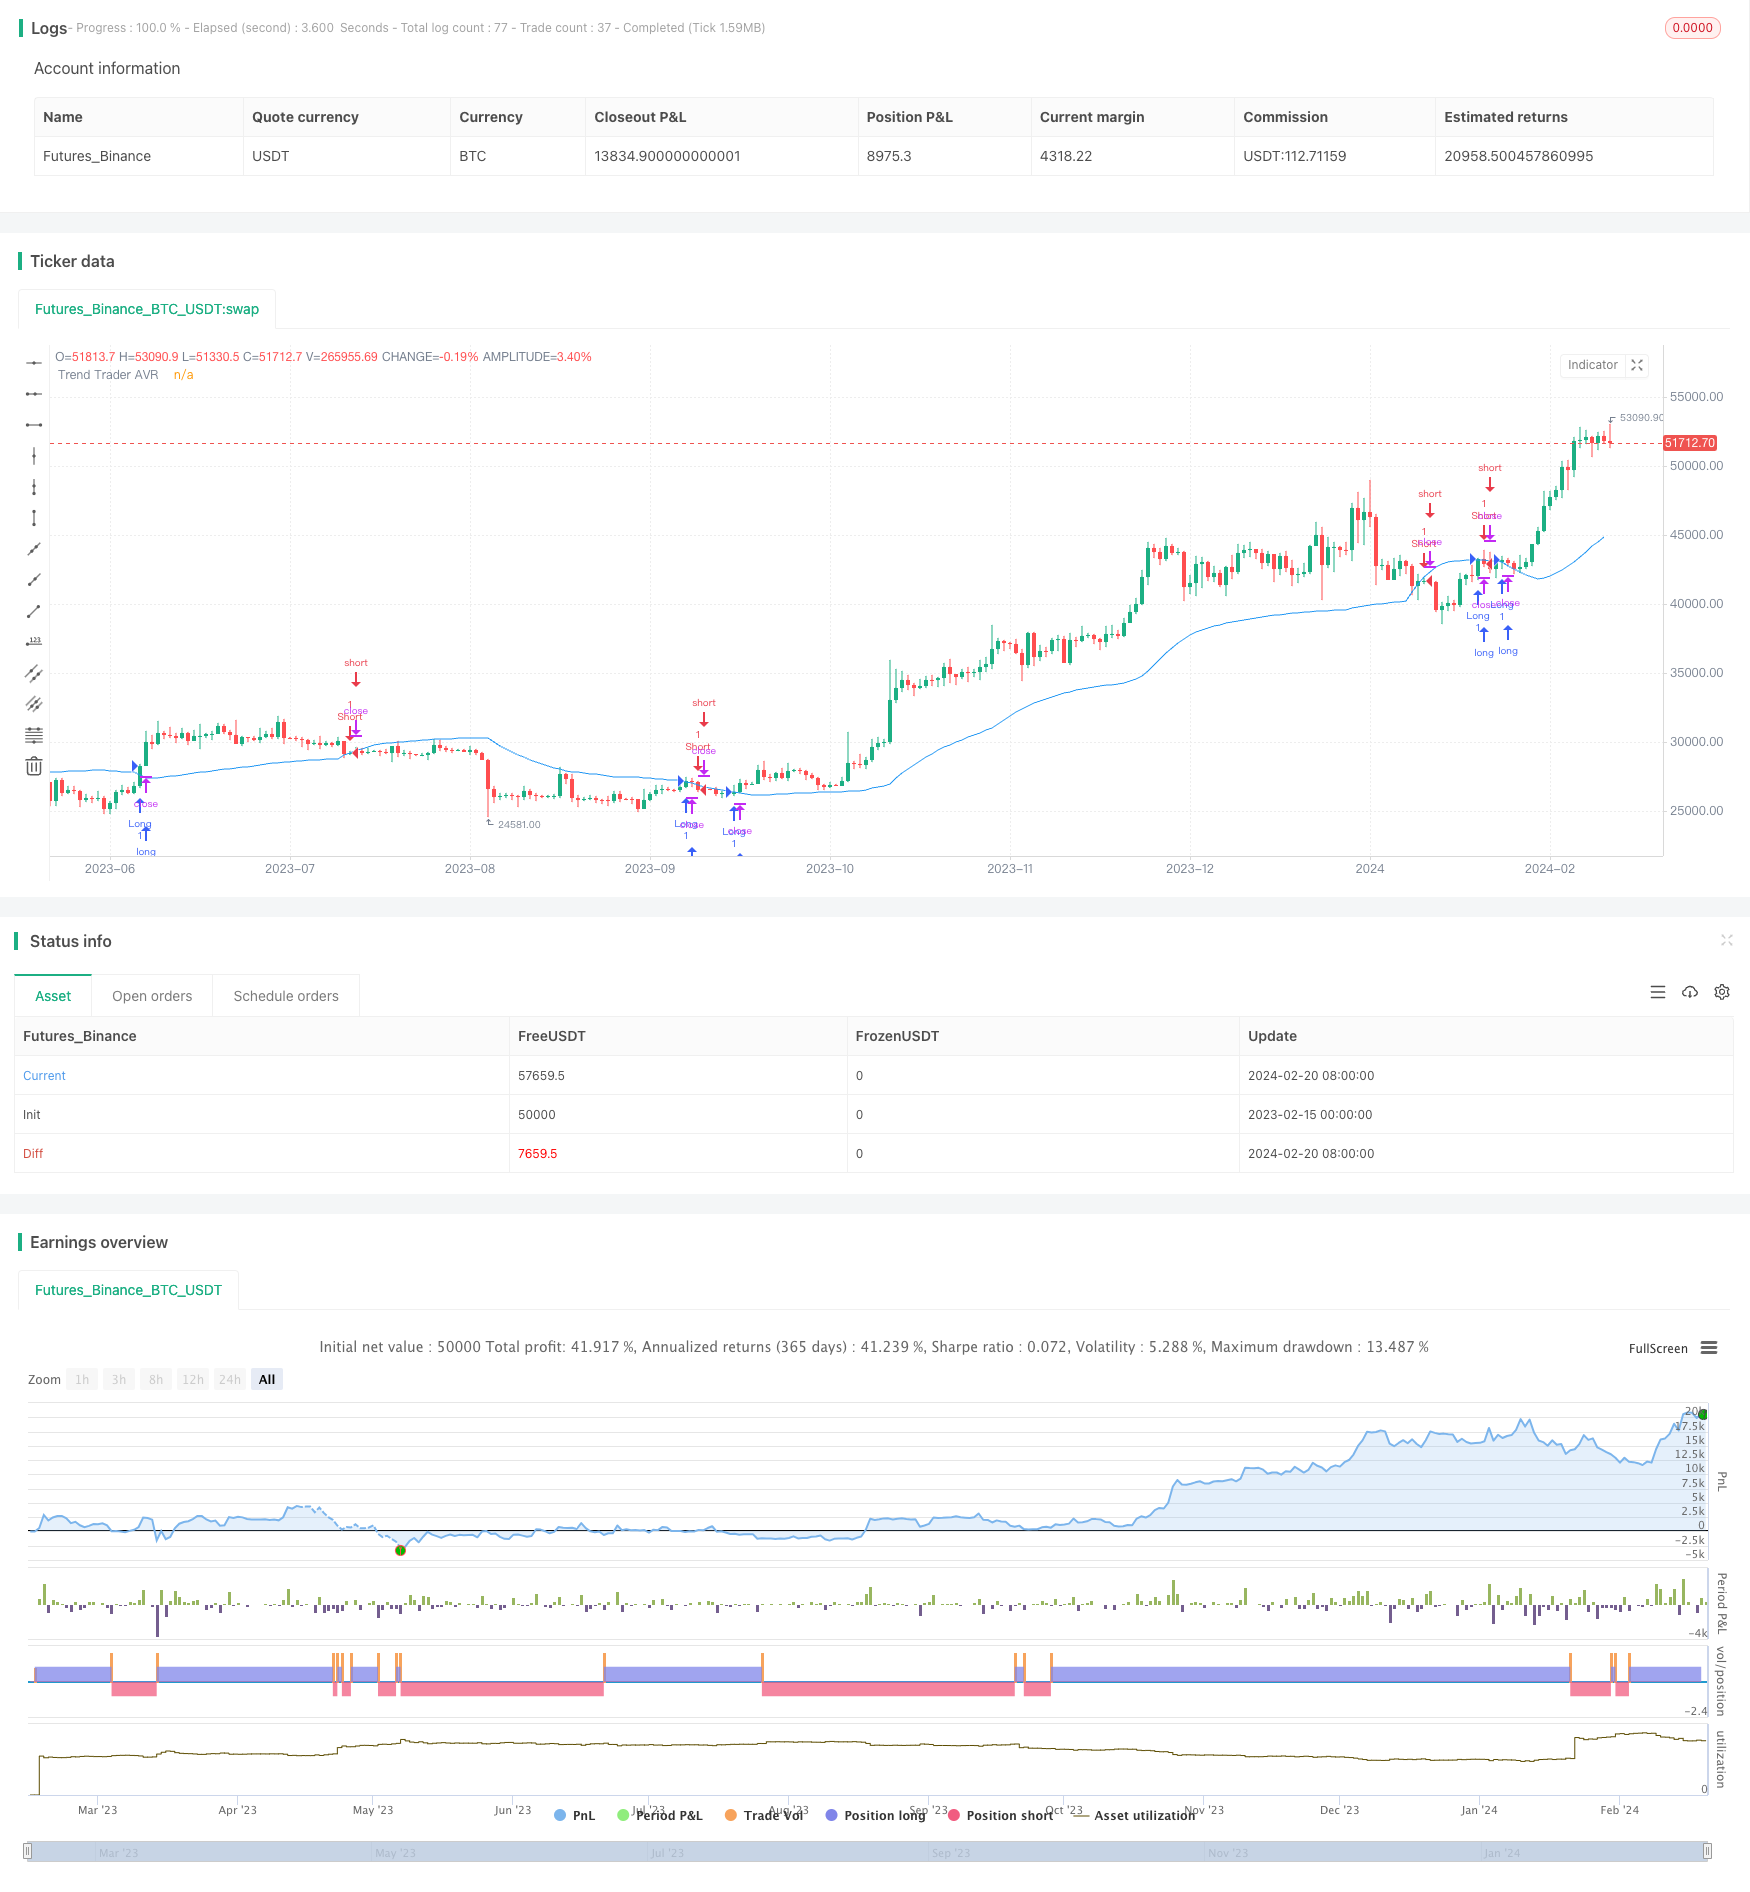
/*backtest
start: 2023-02-15 00:00:00
end: 2024-02-21 00:00:00
period: 1d
basePeriod: 1h
exchanges: [{"eid":"Futures_Binance","currency":"BTC_USDT"}]
*/

//@version=3
////////////////////////////////////////////////////////////
//  Copyright by HPotter v1.0 10/10/2018
// This is plots the indicator developed by Andrew Abraham
// in the Trading the Trend article of TASC September 1998
// It was modified, result values wass averages.
////////////////////////////////////////////////////////////
strategy(title="Trend Trader AVR Backtest", overlay = true)
Length = input(21, minval=1),
LengthMA = input(21, minval=1),
Multiplier = input(3, minval=1)
reverse = input(false, title="Trade reverse")
avgTR      = wma(atr(1), Length)
highestC   = highest(Length)
lowestC    = lowest(Length)
hiLimit = highestC[1]-(avgTR[1] * Multiplier)
loLimit = lowestC[1]+(avgTR[1] * Multiplier)
ret = 0.0
ret :=  iff(close > hiLimit and close > loLimit, hiLimit,
         iff(close < loLimit and close < hiLimit, loLimit, nz(ret[1], 0)))
nResMA = ema(ret, LengthMA)
pos = 0
pos := iff(close < nResMA, -1,
       iff(close > nResMA, 1, nz(pos[1], 0)))
possig = iff(reverse and pos == 1, -1,
          iff(reverse and pos == -1, 1, pos))
if (possig == 1)
    strategy.entry("Long", strategy.long)
if (possig == -1)
    strategy.entry("Short", strategy.short)
barcolor(possig == -1 ? red: possig == 1 ? green : blue )
plot(nResMA, color= blue , title="Trend Trader AVR")