概述
反转动量破窗策略(Reversal Momentum Breakout Strategy)是一个利用价格反转和动量指标来产生交易信号的量化交易策略。该策略基于“动量先行”的理论,通过追踪一定周期内的最高价和最低价,判断市场是否处于反转的关键点,以捕捉反转机会。
策略原理
该策略主要通过计算指定周期(如20天)内的最高价和最低价,判断市场是否处于关键的反转点。具体逻辑如下:
计算最近20天的最高价(window_high)和最低价(window_low)。
如果当前K线的最高价高于过去20天的最高价(即出现新高),则进入高点反转监测期,计数器置为5天。
如果最高价未创出新高,则每日计数器减1。当计数器减为0时,高点反转监测期结束。
对最低价的判断逻辑相似,如果出现新低,则进入低点反转监测期。
在反转监测期内,进行做多或做空操作。如果在反转关键点附近出现反转信号,则可以捕捉较大的行情。
该策略同时设定了开始交易的时间,避免在历史数据中产生交易信号。
优势分析
反转动量破窗策略具有以下主要优势:
捕捉反转机会,适合反转行情。在市场持续上涨或下跌后,常出现一定程度的反转。该策略可以捕捉这些转折点。
动量先行,比较灵敏。计算一定周期的最高价和最低价,可以比较敏感地判断价格反转的趋势和时机。
设定反转监测期,避免假信号。仅在反转关键点附近出信号,可以过滤掉部分噪音。
允许做多做空操作。根据行情方向进行长短头交替操作。
规则相对简单,容易实现。该策略主要依赖简单的价格和动量指标,容易转化为代码实现。
风险分析
反转动量破窗策略也存在以下主要风险:
反转预判不准。市场持续directional时,该策略会产生损失。
无法全面考量大盘走势。个股反转不一定代表大盘反转,需要结合大盘分析。
回撤可能较大。反转没有出现时,NetDevice可能扩大。
数据拟合风险。策略可能过于依赖历史数据,实盘中效果可能差于回测。
参数敏感。窗口期和反转计数器等参数的设置会影响策略稳定性。
对应风险的解决方法包括:优化止损策略,考量大盘因素,调整参数组合进行稳定性检验等。
优化方向
该策略的主要优化方向包括:
结合大盘指标。比较大盘强弱,避免在大盘不利的环境中进行反转。
多因子筛选标的。选择财务状况优良,基本面向好,价格被高估的个股。
优化参数组合。调整窗口期,反转计数器参数,寻找最优参数组合。
添加止损策略。如跟踪型止损、幅度止损等,控制最大回撤。
增加机器学习。使用AI模型预测价格反转概率,提高信号准确性。
总结
反转动量破窗策略通过跟踪价格和动量指标,寻找反转机会。它反应灵敏,可以识别反转的趋势和时点。但也存在一定程度的风险,需要进行适当优化和风险控制。总体而言,在掌握该策略的原理并做出优化后,它可以成为量化交易体系的有效组成部分。
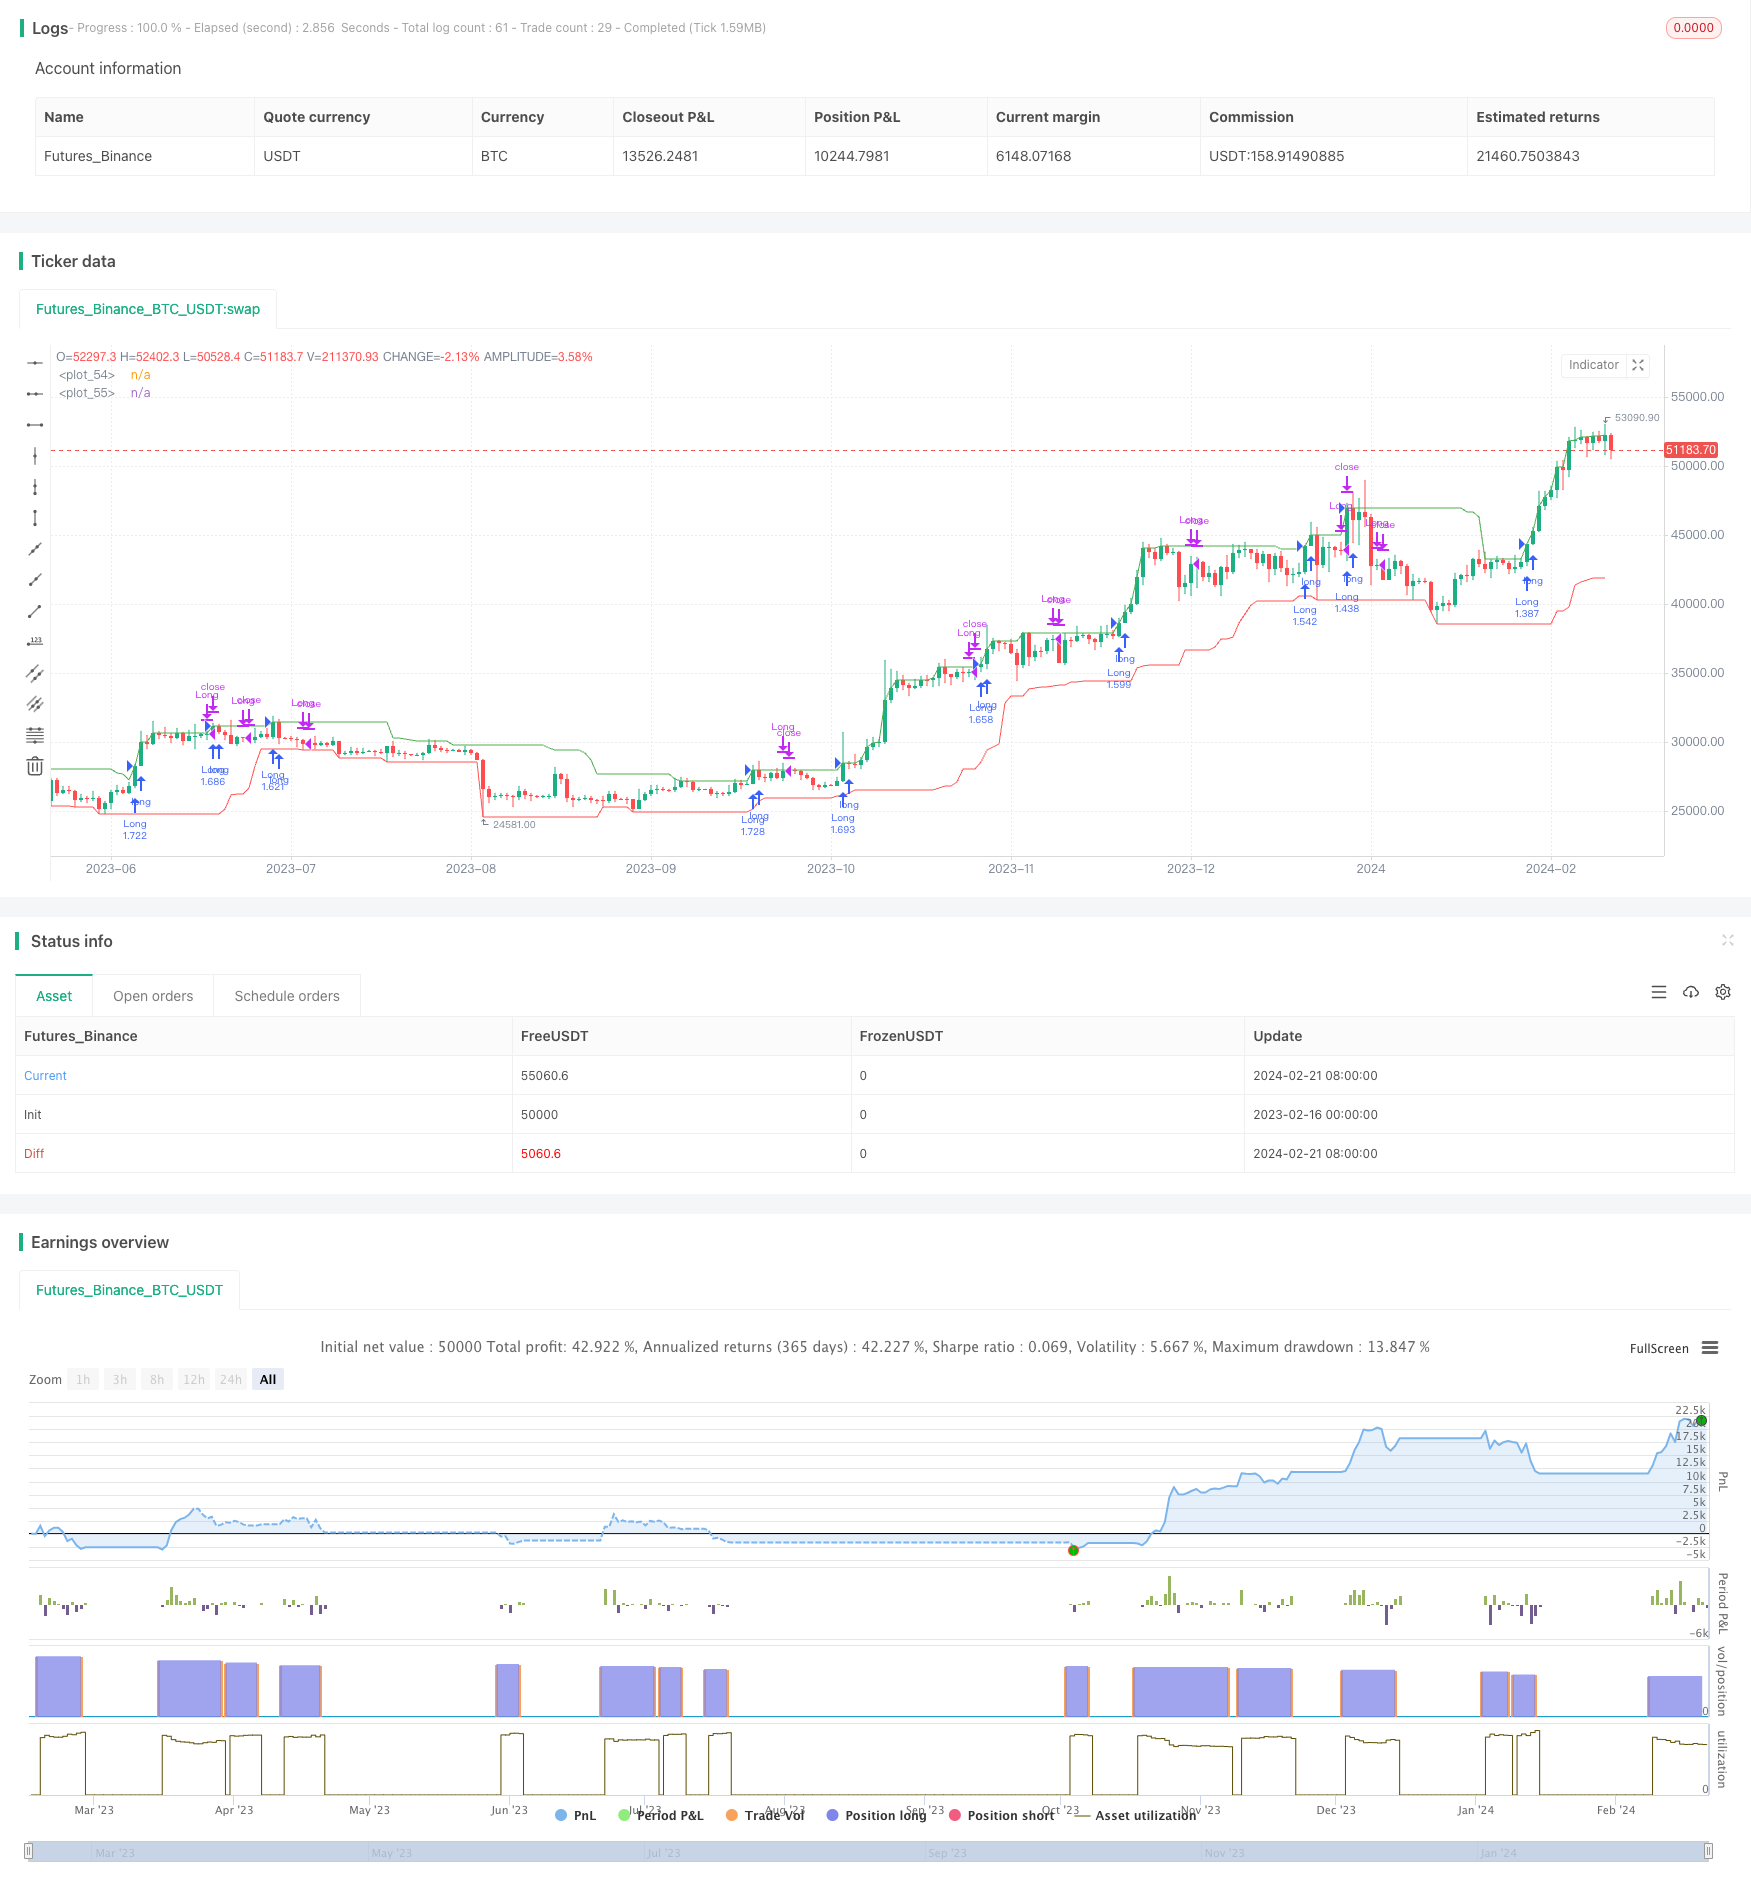
/*backtest
start: 2023-02-16 00:00:00
end: 2024-02-22 00:00:00
period: 1d
basePeriod: 1h
exchanges: [{"eid":"Futures_Binance","currency":"BTC_USDT"}]
*/

//@version=5
strategy("New Highs and Lows Momentum Strategy", overlay = true, default_qty_type = strategy.percent_of_equity, default_qty_value = 100)

window = input.int(20, title="New Highs and Lows Window", minval=1)
decay = input.int(5, title="Decay", minval=1)
startDate = input(timestamp("1 Jan 2023"), title = "Start Date")
allowShort = input.bool(false, title = "Allow shorting")

var int highDecayCounter = 0
var bool isHighPeriod = false
var int lowDecayCounter = 0
var bool isLowPeriod = false

inTradeWindow = true

window_high = ta.highest(close, window)
window_low = ta.lowest(low, window)

// Logic for Highs
if window_high > ta.highest(close, window)[1]
    highDecayCounter := decay
    isHighPeriod := true
else
    if highDecayCounter > 0
        highDecayCounter := highDecayCounter - 1
    else
        isHighPeriod := false

// Logic for Lows
if window_low < ta.lowest(low, window)[1]
    lowDecayCounter := decay
    isLowPeriod := true
else
    if lowDecayCounter > 0
        lowDecayCounter := lowDecayCounter - 1
    else
        isLowPeriod := false

// Strategy Execution
if inTradeWindow
    if isHighPeriod and highDecayCounter == decay
        strategy.entry("Long", strategy.long)

    if isHighPeriod and highDecayCounter == 0
        strategy.close("Long")

    if isLowPeriod and lowDecayCounter == decay and allowShort
        strategy.entry("Short", strategy.short)

    if isLowPeriod and lowDecayCounter == 0 and allowShort
        strategy.close("Short")

// Plotting
plot(window_high, color=color.green)
plot(window_low, color=color.red)