概述
本策略基于移动平均线的交叉信号来进行买入和卖出操作。策略使用8日,18日和50日的指数移动平均线(EMA)。当价格上涨突破8日EMA且高于50日EMA时产生买入信号;当8日EMA下破18日EMA时产生卖出信号。
原理
移动平均线能够有效地滤波价格波动,反映价格趋势。快速移动平均线能更快地响应价格变化。当快速移动平均线上涨越过慢速移动平均线时,表示价格开始上涨;反之,当快速移动平均线下跌穿过慢速移动平均线时,表示价格开始下跌。
本策略就是利用不同周期移动平均线的交叉来判断价格趋势的变化,以产生交易信号。具体来说,策略使用以下移动平均线:
- 8日EMA:快速响应价格变化,用于判断短期趋势
- 18日EMA:中速响应价格变化,用于判断中期趋势
- 50日EMA:慢速响应价格变化,用于判断长期趋势
当短期上涨趋势(8日EMA上涨)与中长期趋势(价格高于50日EMA)同向突破时,产生买入信号。当短期上涨趋势(8日EMA)被中期下跌趋势(18日EMA下跌)打破时,产生卖出信号。
优势分析
本策略具有以下优势:
- 策略信号明确,交易规则简单清晰。
- 利用多周期EMA判断趋势,可有效识别价格反转。
- EMA滤波价格波动,可减少不必要的交易。
- 实时性较强,快速响应突发事件。
风险分析
本策略也存在一些风险:
- EMA具有滞后性,可能错过价格反转的最佳时间点。
- 回撤可能比较大,需要严格的止损控制。
- 参数设置较为主观,不同市场需要调整周期。
- 行情剧烈波动时,EMA交叉信号可能频繁,增加交易成本和难度。
针对风险,可以通过以下方法加以优化和改进:
- 结合其他技术指标判断行情时机,提高策略胜率。
- 设置止损点,严格控制单笔损失。
- 对参数和过滤条件进行测试和优化,适应不同市场环境。
- 增加过滤条件,避免行情剧烈波动时的频繁交易。
优化方向
本策略还可从以下方面进一步优化:
- 优化移动平均线的周期参数,寻找最佳参数组合。
- 增加其他技术指标判断,优化入场时机。比如结合RSI指标避免超买超卖现象。
- 增加止损机制。设置移动止损或挂单止损。
- 结合交易量分析。只在交易量放大的情况下考虑信号。
- 测试不同品种参数健壮性。调整参数适应不同交易品种。
总结
本策略整体来说较为简单实用。核心在于利用不同周期EMA的交叉来判断价格趋势。策略实时性较强,可快速响应行情。但也存在一些后化管理风险,需要进一步测试和优化以适应不同市场环境。整体来说是一个稳定可靠的量化交易策略。
策略源码
/*backtest
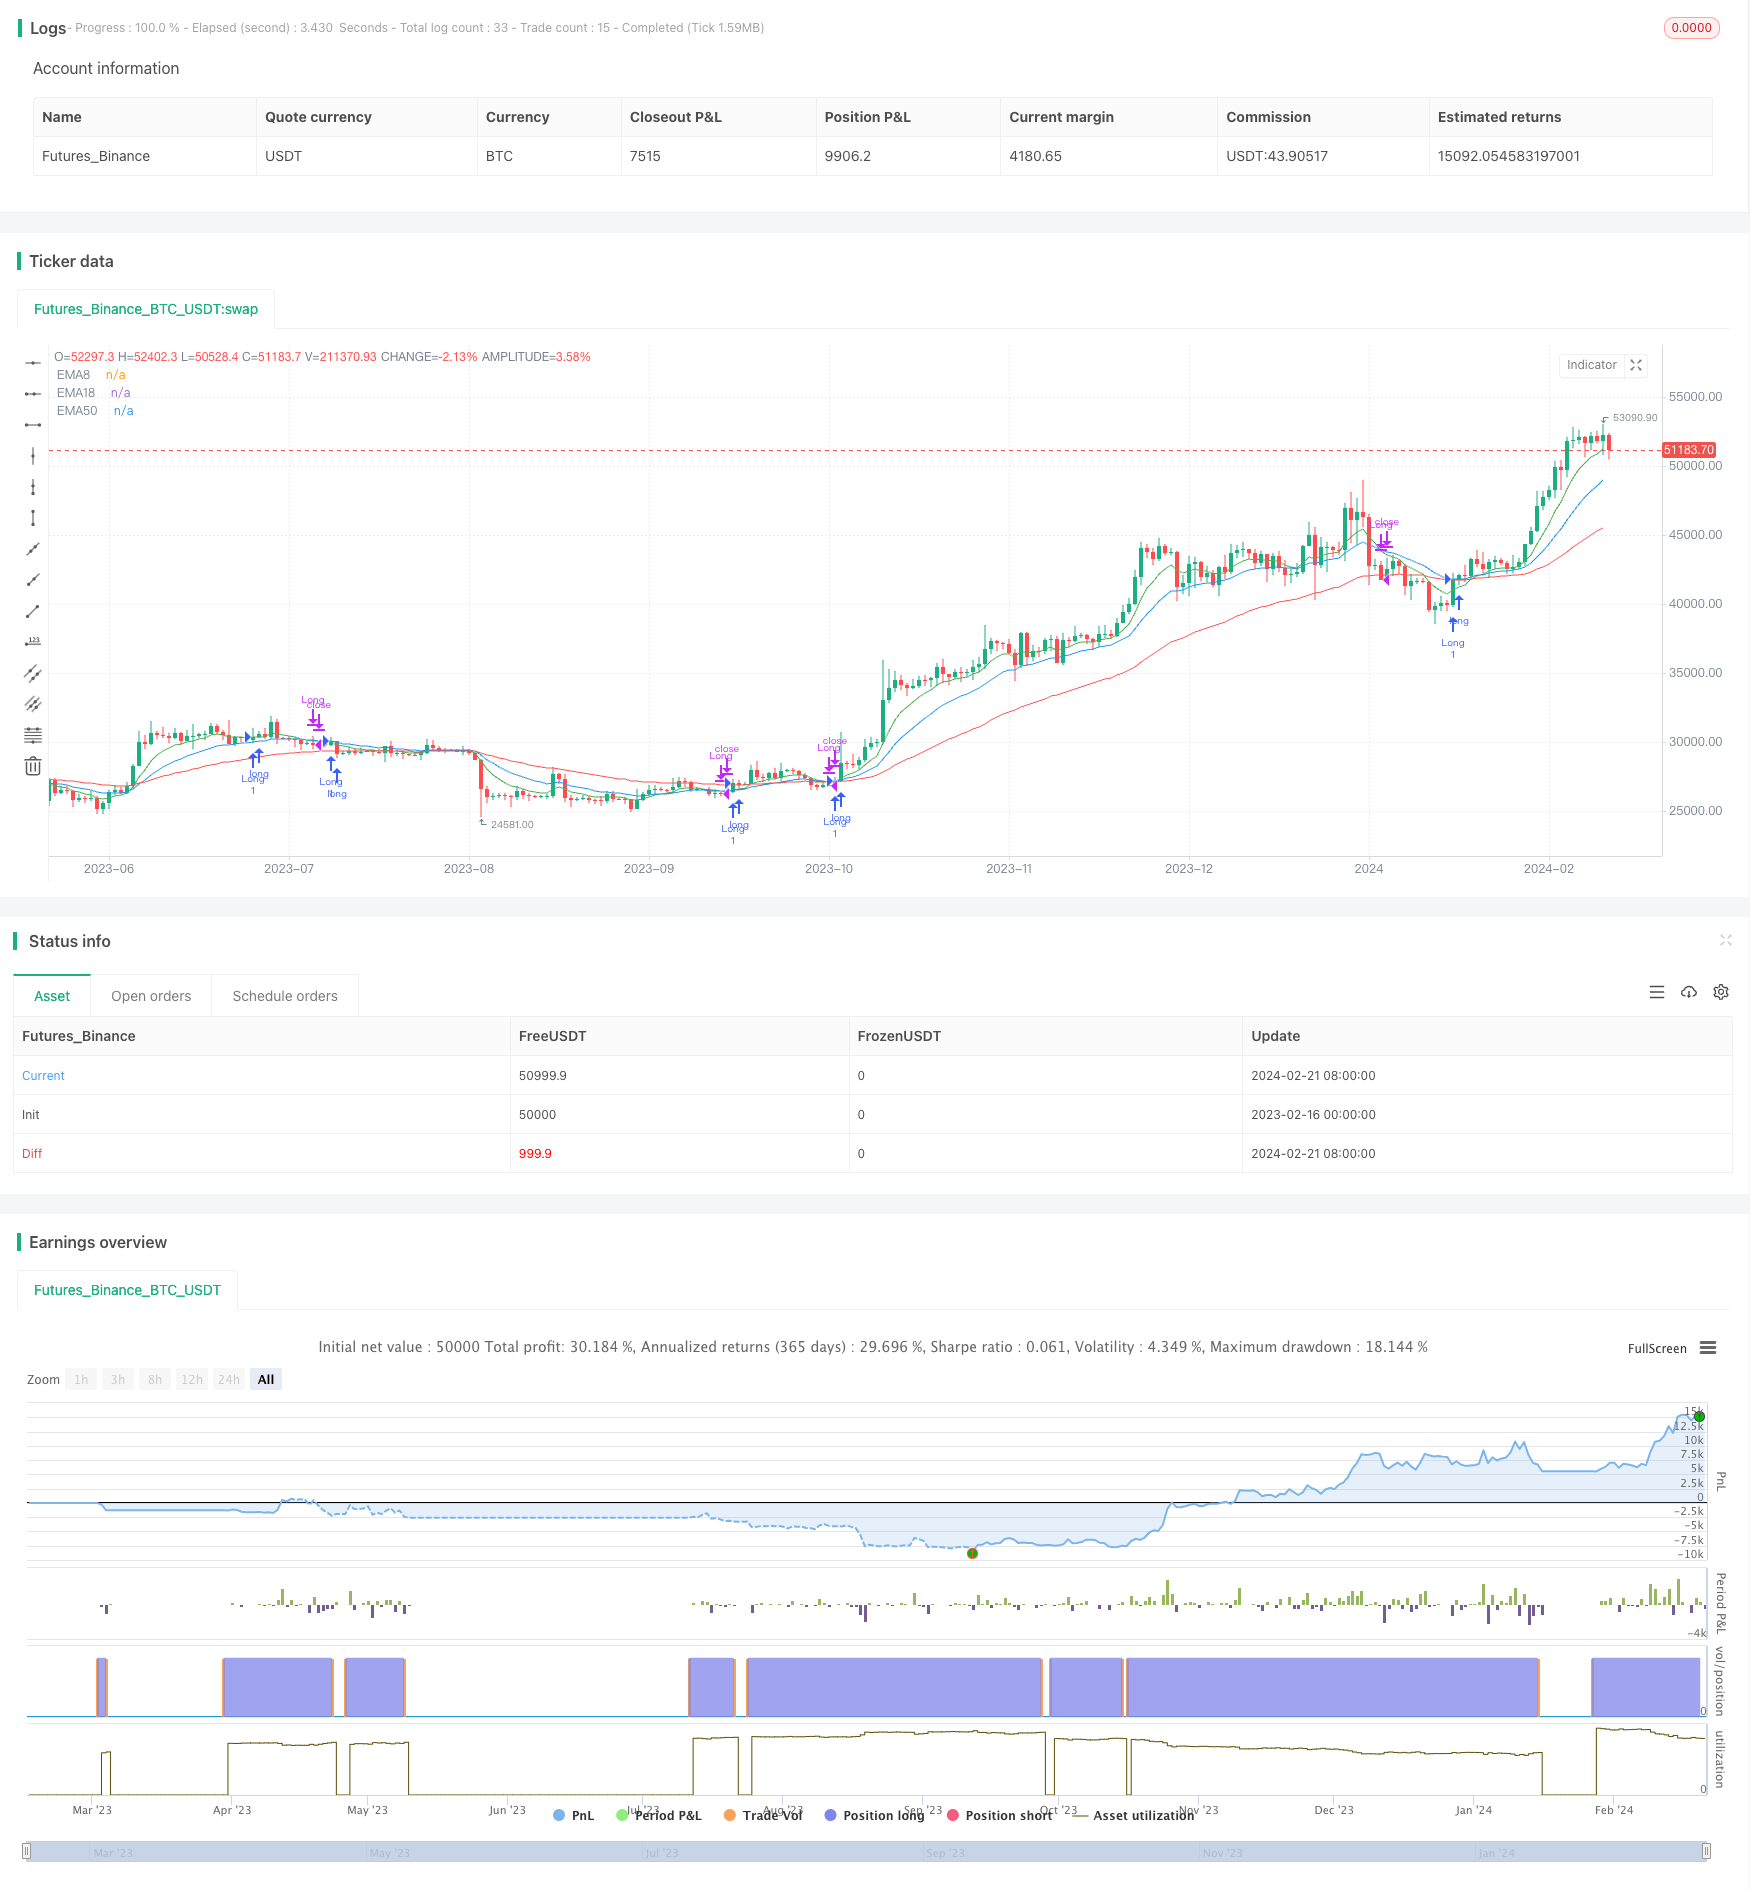
start: 2023-02-16 00:00:00
end: 2024-02-22 00:00:00
period: 1d
basePeriod: 1h
exchanges: [{"eid":"Futures_Binance","currency":"BTC_USDT"}]
*/
//@version=5
strategy('Trading EMAs', overlay=true)
// Definir las medias móviles con colores personalizados
ema8 = ta.ema(close, 8)
ema18 = ta.ema(close, 18)
ema50 = ta.ema(close, 50)
plot(ema8, color=color.new(color.green, 0), title='EMA8')
plot(ema18, color=color.new(color.blue, 0), title='EMA18')
plot(ema50, color=color.new(color.red, 0), title='EMA50')
// Condiciones de entrada
longCondition = ta.crossover(close, ema8) and close > ema50 // Señal de compra cuando el precio de cierre cruza al alza la EMA de 8 y el precio está por encima de la EMA de 50
// Condiciones de salida
exitLongCondition = ta.crossunder(ema8, ema18) // Señal de venta cuando EMA8 cruza por debajo de EMA18
// Ejecutar las operaciones basadas en las condiciones de entrada
if longCondition
strategy.entry('Long', strategy.long)
// Salida de las operaciones basadas en las condiciones de salida
if exitLongCondition
strategy.close('Long')