SuperTrend Bollinger Bands Dual Moving Average Trading Strategy

Author: ChaoZhang, Date: 2024-02-23 13:58:36
Tags:

img

Overview

This strategy integrates multiple technical indicators, including Supertrend, Dual Moving Average (DEMA), and Bollinger Bands, to take advantage of their strengths and generate more accurate trading signals.

Strategy Logic

The strategy uses a 12-period ATR and price average to calculate the upper and lower bands of Supertrend and identifies long and short signals when price breaks through those bands. Meanwhile, a 200-period DEMA serves as an auxiliary indicator for trend judgment. In addition, Bollinger Bands help determine the optimal timing for entries and stop losses.

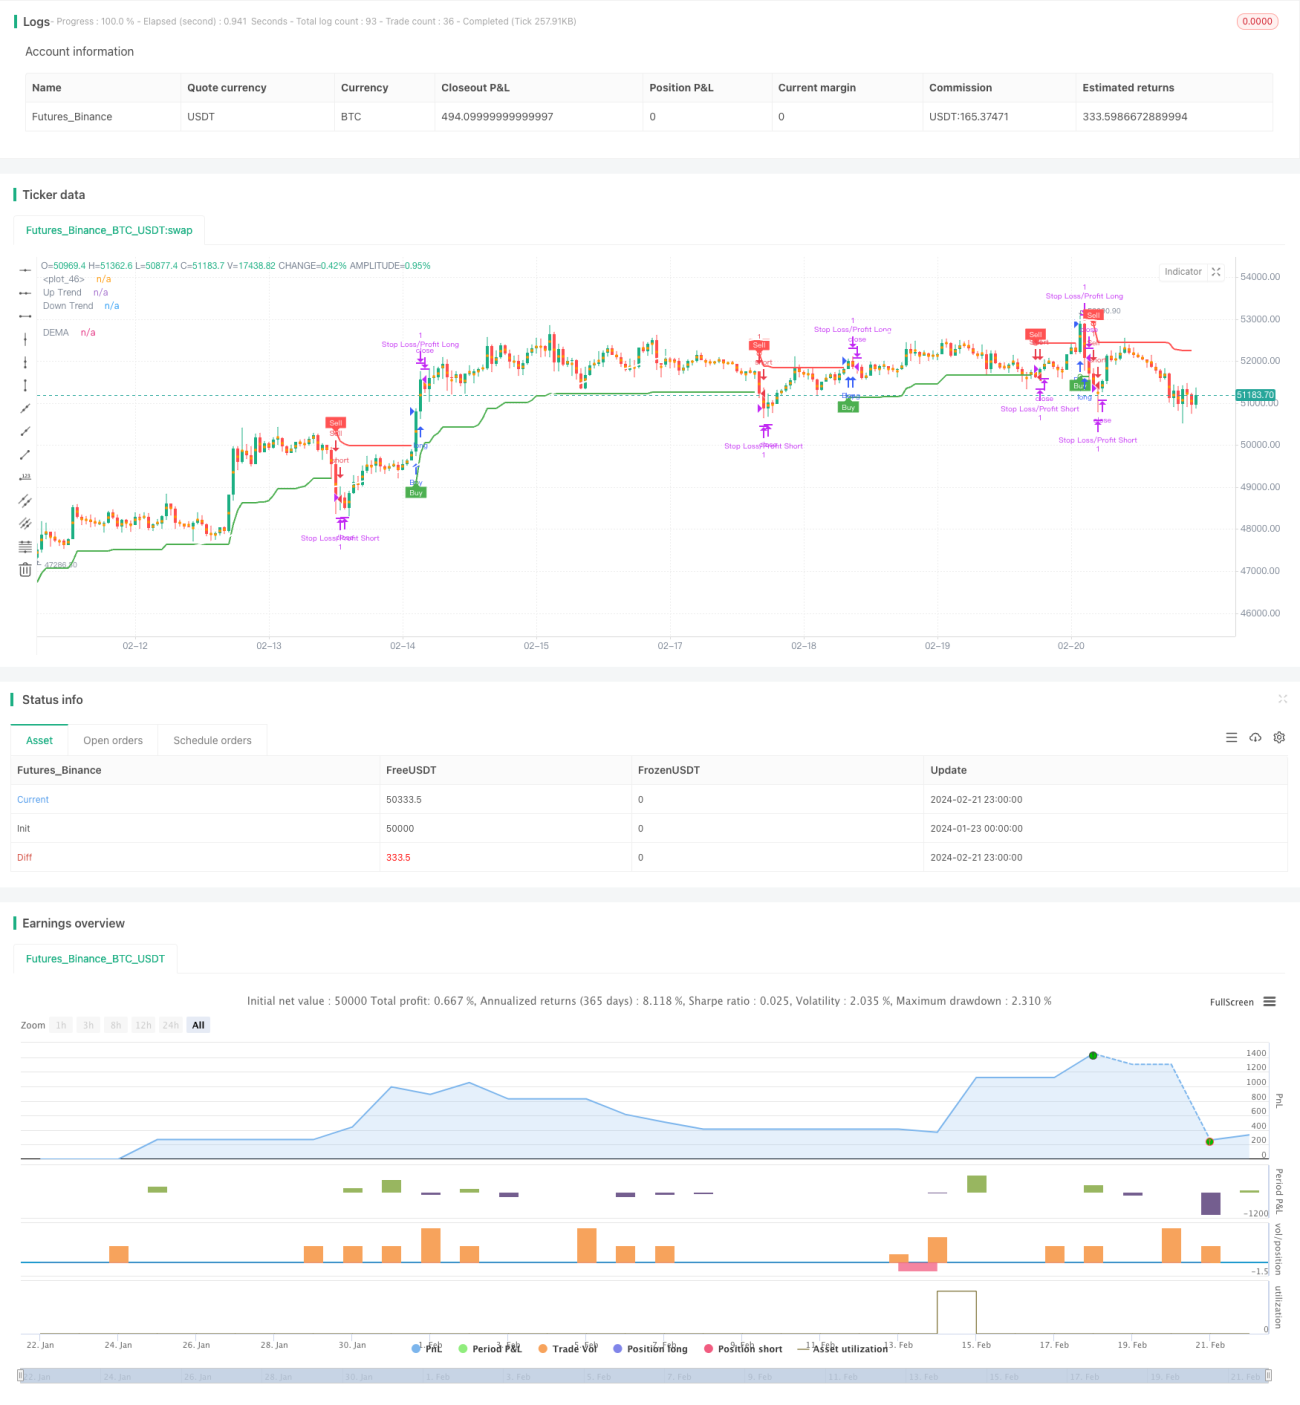
Buy signals are generated when price breaks above the upper band. Sell signals are generated when price breaks below the lower band. When price breaks through Supertrend’s upper or lower band, markers and the text “Buy” or “Sell” will be plotted at corresponding bands. Mobile alerts are also sent out simultaneously.

The DEMA is plotted above or below the price curve in white color for judging the overall market trend direction.

The Bollinger Bands are used to identify the best timing for entries and stop losses. Its upper and lower bands form a channel encompassing price fluctuations, which helps determine when prices have departed from their normal range, i.e. become excessively volatile.

After entering a trade, the strategy utilizes stop loss and take profit methods to lock in profits or reduce losses by setting stop loss price and take profit price for automatic position reduction.

Advantage Analysis

Integrating multiple indicators allows this strategy to make the most of their individual strengths for generating more accurate trading signals.

Supertrend is capable of filtering out market noise and avoids over-trading. The DEMA can determine the general trend direction and prevent trading against the trend. Bollinger Bands pinpoint optimal timing for entries and stop losses.

Mobile alerts enable timely trading prompts. Automatic stop loss and take profit allow locking in profits and cutting losses.

Risk Analysis

The integration of multiple indicators increases the complexity of the strategy and the probability of errors. Indicator parameter settings could also lead to missing trading opportunities or generating false signals.

In addition, over-aggressive stop loss settings may amplify losses. The stability of mobile alerts also impacts the effectiveness of timely profit-taking and stop losses.

Optimization Directions

Different parameter combinations could be tested to find the optimal parameter set. Parameters can also be adjusted based on different market conditions.

Attempting standalone usage of individual indicators may reduce false signals. Supplementary indicators could also be added for further optimization.

Stop loss and take profit criteria are also subject to adjustments such as trailing stop loss and partial stop loss.

Summary

This strategy combines the strengths of multiple technical indicators for trade signal generation and has relatively high practicality. But it also faces certain risks and requires continual testing and optimization to be effectively and profitably employed.


/*backtest
start: 2024-01-23 00:00:00
end: 2024-02-22 00:00:00
period: 1h
basePeriod: 15m
exchanges: [{"eid":"Futures_Binance","currency":"BTC_USDT"}]
*/

// This Pine Script™ code is subject to the terms of the Mozilla Public License 2.0 at https://mozilla.org/MPL/2.0/
// © zhuenrong

//@version=4
strategy("Supertrend + DEMA + Bollinger Bands", overlay=true)

// Input parameters for Supertrend
atrLength = input(title="ATR Period", type=input.integer, defval=12)
src = input(hl2, title="Source")
multiplier = input(title="ATR Multiplier", type=input.float, step=0.1, defval=3.0)
changeATR = input(title="Change ATR Calculation Method?", type=input.bool, defval=true)
showSupertrend = input(title="Show Supertrend Indicator?", type=input.bool, defval=true)

// Input parameters for DEMA
demaLength = input(200, title="DEMA Period")
showDEMA = input(title="Show DEMA Indicator?", type=input.bool, defval=true)

// Calculate ATR for Supertrend
atr2 = sma(tr, atrLength)
atr = changeATR ? atr(atrLength) : atr2

// Calculate Supertrend
up = src - (multiplier * atr)
up1 = nz(up[1], up)
up := close[1] > up1 ? max(up, up1) : up

dn = src + (multiplier * atr)
dn1 = nz(dn[1], dn)
dn := close[1] < dn1 ? min(dn, dn1) : dn

trend = 1
trend := nz(trend[1], trend)
trend := trend == -1 and close > dn1 ? 1 : trend == 1 and close < up1 ? -1 : trend

// Plot Supertrend
upPlot = plot(showSupertrend ? (trend == 1 ? up : na) : na, title="Up Trend", style=plot.style_linebr, linewidth=2, color=color.new(color.green, 0))
buySignal = trend == 1 and trend[1] == -1
plotshape(buySignal ? up : na, title="UpTrend Begins", location=location.absolute, style=shape.circle, size=size.tiny, color=color.new(color.green, 0))
plotshape(buySignal ? up : na, title="Buy", text="Buy", location=location.absolute, style=shape.labelup, size=size.tiny, color=color.new(color.green, 0), textcolor=color.new(color.white, 0))

dnPlot = plot(showSupertrend ? (trend == 1 ? na : dn) : na, title="Down Trend", style=plot.style_linebr, linewidth=2, color=color.new(color.red, 0))
sellSignal = trend == -1 and trend[1] == 1
plotshape(sellSignal ? dn : na, title="DownTrend Begins", location=location.absolute, style=shape.circle, size=size.tiny, color=color.new(color.red, 0))
plotshape(sellSignal ? dn : na, title="Sell", text="Sell", location=location.absolute, style=shape.labeldown, size=size.tiny, color=color.new(color.red, 0), textcolor=color.new(color.white, 0))

mPlot = plot(ohlc4, title="", style=plot.style_circles, linewidth=0)

longFillColor = (trend == 1 ? color.new(color.green, 80) : color.new(color.white, 0))
shortFillColor = (trend == -1 ? color.new(color.red, 80) : color.new(color.white, 0))

fill(mPlot, upPlot, title="UpTrend Highlighter", color=longFillColor)
fill(mPlot, dnPlot, title="DownTrend Highlighter", color=shortFillColor)

// Alert conditions
alertcondition(buySignal, title="Custom Supertrend Buy", message="Custom Supertrend Buy!")
alertcondition(sellSignal, title="Custom Supertrend Sell", message="Custom Supertrend Sell!")

// Calculate DEMA
ema1 = ema(close, demaLength)
dema = 2 * ema1 - ema(ema1, demaLength)

// Plot DEMA with white color
plot(showDEMA ? dema : na, color=color.new(color.white, 0), title="DEMA", linewidth=2)
// Add push notification on mobile if buy and sell occurred
if (buySignal)
    strategy.entry("Buy", strategy.long)
    //strategy.exit("Sell")
    //alert("Buy Signal - Supertrend")

if (sellSignal)
    strategy.entry("Sell", strategy.short)
    //strategy.exit("Cover")
    //alert("Sell Signal - Supertrend")


// === Stop LOSS ===

if strategy.position_size>0
    strategy.exit("Stop Loss/Profit Long","Buy", stop=strategy.position_avg_price*100, limit=strategy.position_avg_price*1.1)
if strategy.position_size<0
    strategy.exit("Stop Loss/Profit Short","Sell", stop=strategy.position_avg_price*100, limit=strategy.position_avg_price*1.1)

More