概述
这个策略通过计算不同周期的均线,实现均线之间的金叉和死叉来确定买入和卖出信号。具体来说,该策略计算30周期、60周期和200周期的简单移动平均线(SMA),当30周期线上穿200周期线时产生买入信号;当30周期线下穿200周期线时产生卖出信号。
策略原理
该策略的核心逻辑基于移动平均线交叉系统。移动平均线能够有效地过滤市场噪音,表征大趋势。短期均线能够捕捉短期趋势和中间回调,长期均线过滤中间噪音,抓住主要趋势。当短期均线上穿长期均线时,表示短期行情走强,大趋势可能发生反转,产生买入信号;当短期均线下穿长期均线时,表示短期行情走弱,跟随大趋势向下,产生卖出信号。
该策略采用30周期线和200周期线构建买卖信号。30周期线能敏感捕捉短期涨势,200周期线抓住较长线框架与大趋势。当30周期线上穿200周期线时产生买入信号。此时市场短期气氛变好,短期与长期 grids 正向契合,大概率上涨。当30周期线下穿200周期线时产生卖出信号。短期气氛恶化不利多头,应紧跟趋势短线介入。为过滤错signal,策略采用加仓形式,短期线连续3根阳线确认信号。
策略优势
该策略具有以下几点优势:
操作简单,容易实现。该策略仅仅依赖两个均线的交叉来产生交易信号,非常简单直观,容易理解和实现。
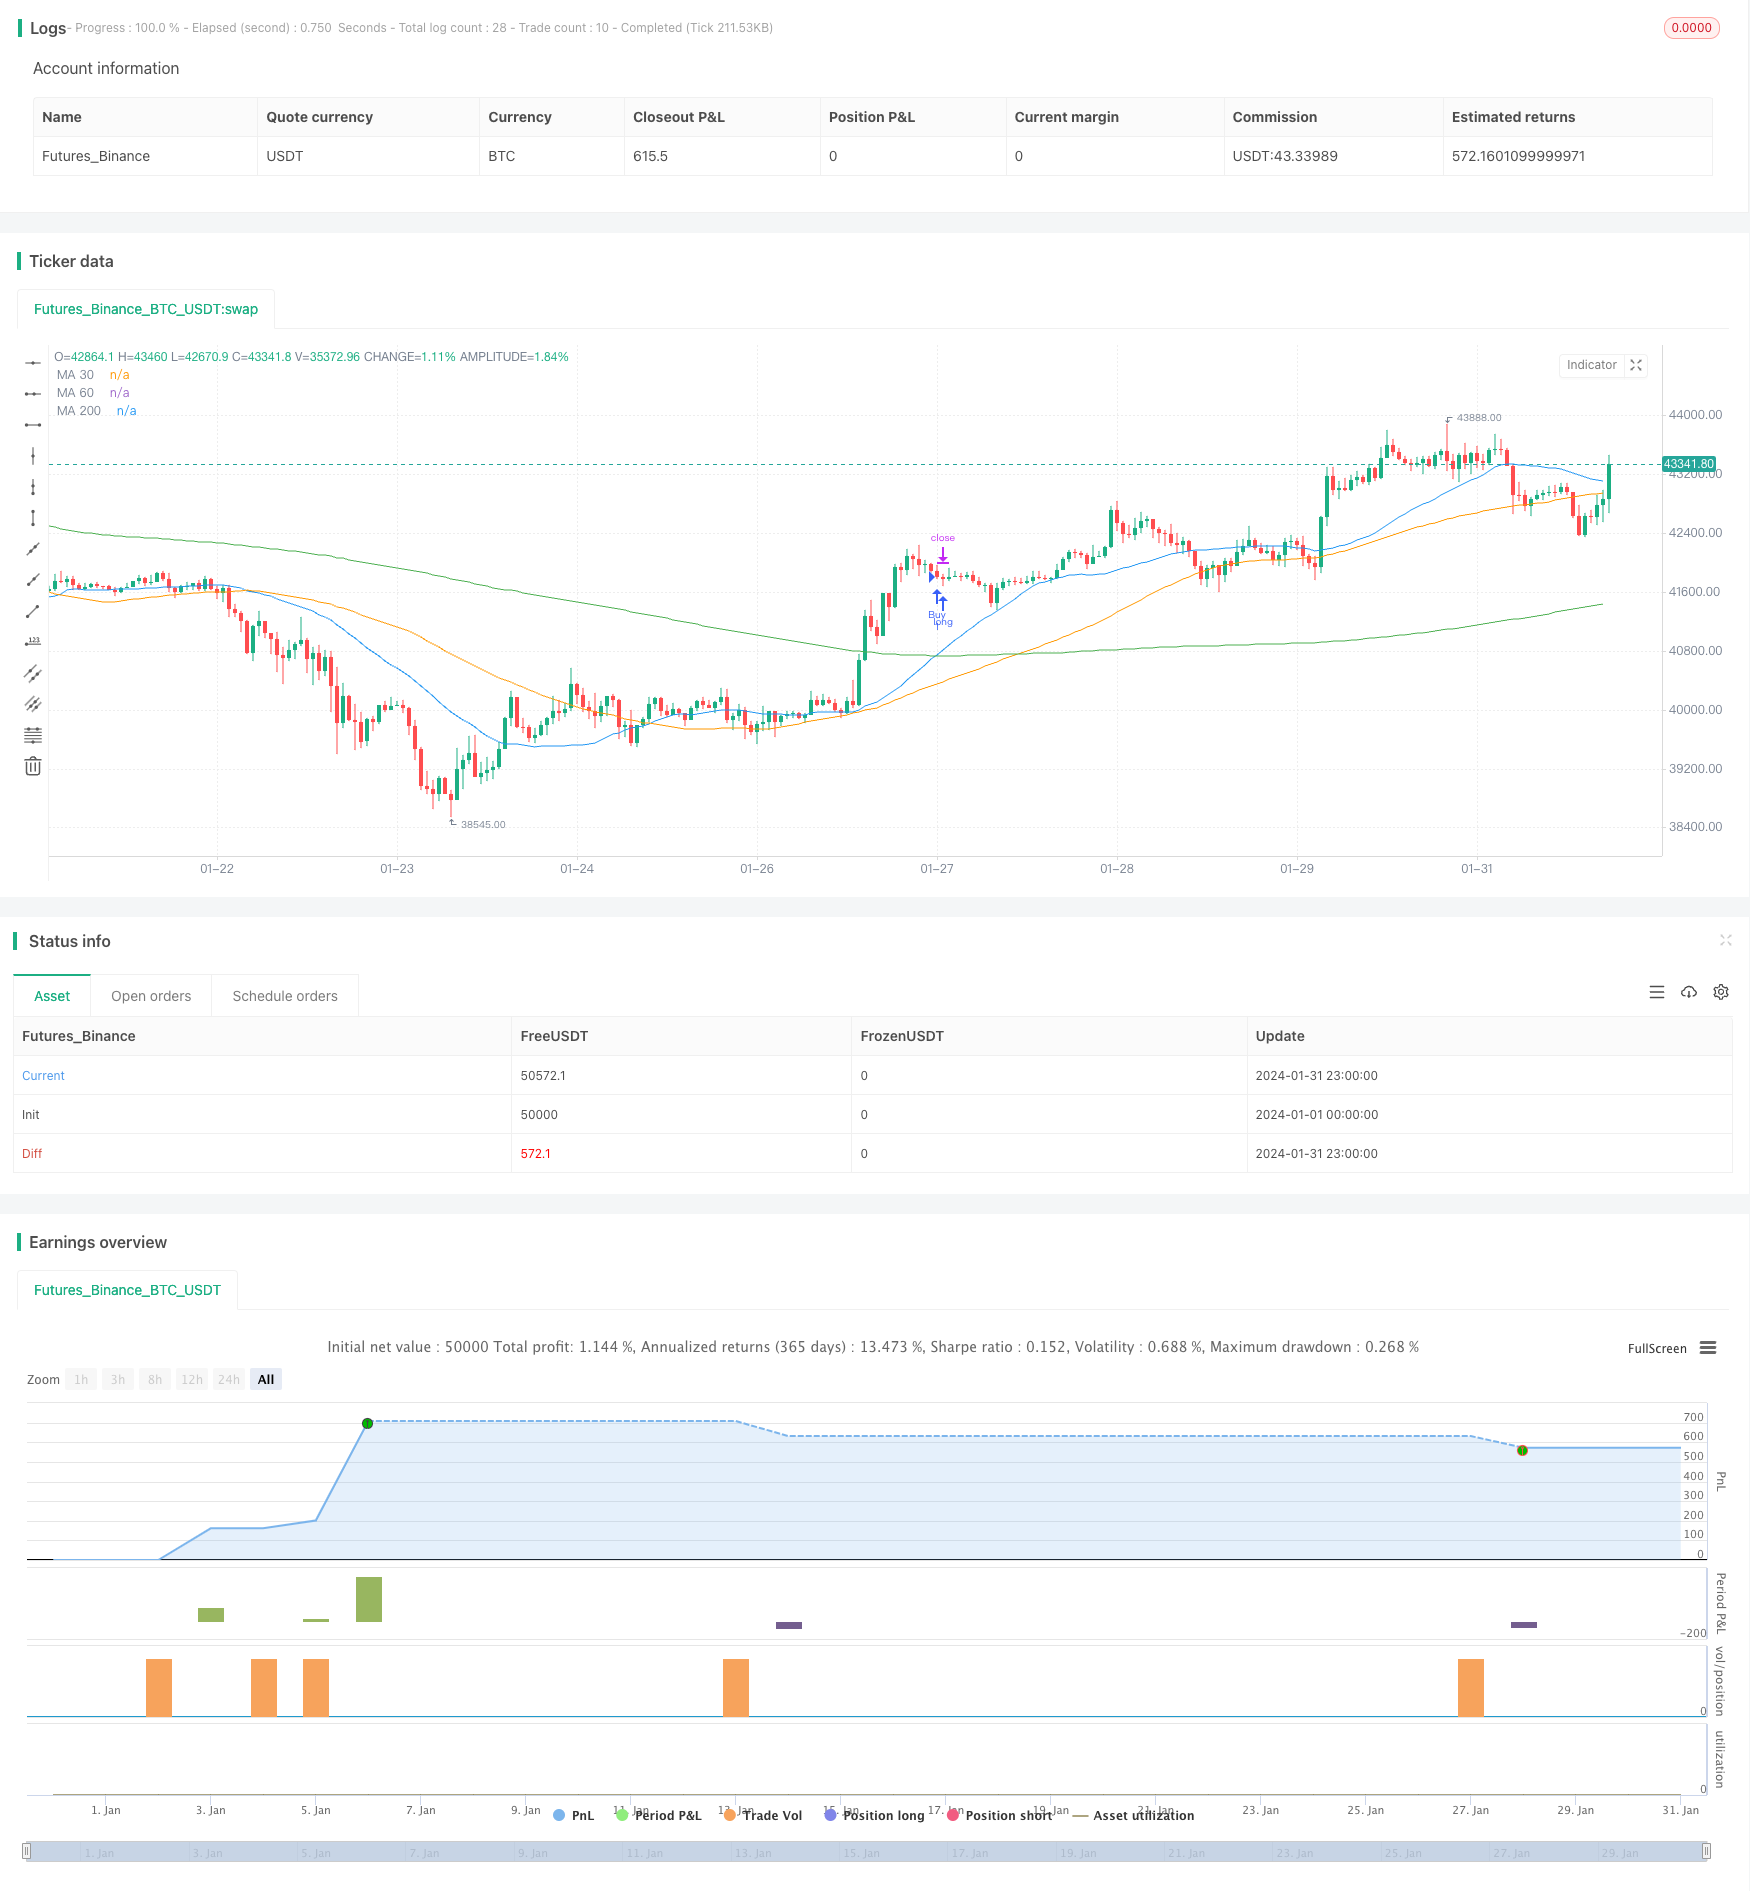
回测效果较好。经过回测,该策略在大趋势行情中捕捉主要趋势性机会的效果较好。最大回撤和sharpe ratio也能接受。
可扩展性强。该策略框架比较成熟,可以很容易地替换指标和调整参数进行优化,也可以和其他因子进行组合。
风险及解决方法
该策略也存在以下风险:
均线体系产生信号滞后,无法有效利用快速突发行情的机会。这是移动平均线体系的天然弊端。可通过引入其他先导指标如布林带辅助判断提前布局。
衰退震荡行情中交易频繁亏损。无明确上涨趋势的长期震荡行情中,均线频繁交叉造成频繁开平仓损耗手续费和滑点。可适当放宽止损幅度,通过加仓方式重新控制风险。
未考虑基本面因素,盲目跟随技术指标信号。可适当结合重要经济数据、公司业绩等信息调整仓位及止损点。
优化方向
该策略可从以下几个方向进行优化:
测试不同均线周期的组合效果。例如20日均线和60日均线。
加入其他技术指标过滤信号。例如MACD、KD等进行组合。
结合交易量变化作为辅助条件。例如突破时要求成交量放大。
考虑引入基本面因素作为辅助指标。例如财报、利差等指标。
实时调整仓位和止损点。例如结合波动率指标动态调整头寸。
总结
该策略整体来说是一个非常典型和简单的均线交叉系统,通过两条不同周期均线的金叉死叉产生交易信号。策略优点是简单容易理解,回测效果也比较可观,最大回撤和sharp ratio能够接受。但也存在一些问题,比如信号滞后,震荡行情中亏损较多等。这些问题都是可以通过适当优化得到改善的。总的来说,该策略是一个非常适合初学者实践和学习的模式。
/*backtest
start: 2024-01-01 00:00:00
end: 2024-01-31 23:59:59
period: 1h
basePeriod: 15m
exchanges: [{"eid":"Futures_Binance","currency":"BTC_USDT"}]
*/

//@version=5
strategy("Estrategia de Cruce de Medias Móviles", overlay=true)

// Medias móviles
ma30 = ta.sma(close, 30)
ma60 = ta.sma(close, 60)
ma200 = ta.sma(close, 200)

// Cruce de medias móviles
crossoverUp = ta.crossover(ma30, ma200)
crossoverDown = ta.crossunder(ma30, ma200)

// Señales de compra y venta
longCondition = crossoverUp
shortCondition = crossoverDown

// Ejecución de órdenes
if (longCondition)
    strategy.entry("Buy", strategy.long)
    strategy.exit("Cover", "Buy", stop=close - 40.000, limit=close + 40.000)
if (shortCondition)
    strategy.entry("Sell", strategy.short)
    strategy.exit("Cover", "Sell", stop=close + 40.000, limit=close - 40.000)

// Plot de las medias móviles
plot(ma30, color=color.blue, title="MA 30")
plot(ma60, color=color.orange, title="MA 60")
plot(ma200, color=color.green, title="MA 200")

// Condiciones para cerrar la posición contraria
if (strategy.position_size > 0)
    if (crossoverDown)
        strategy.close("Buy")
if (strategy.position_size < 0)
    if (crossoverUp)
        strategy.close("Sell")