All about the ATR and EMA based trend following strategy

Overview
The core idea of this strategy is to use the price fluctuation range calculated by the ATR indicator to judge price breakthroughs, and the EMA indicator to judge the overall trend direction, so as to achieve trend following trading. When the price breaks through the upper or lower limit of the ATR range, if the breakthrough direction is consistent with the EMA direction, take long or short positions. The closing condition is that the price breaks through the ATR range again.
Strategy Principle
Firstly, this strategy uses the ATR indicator to calculate the price fluctuation range over a certain period. The upper limit of the ATR range is SMA+ATR, and the lower limit is SMA-ATR. Where SMA represents the simple moving average of the closing price on the day, and ATR represents the True Range Average.
When the price breaks through the upper or lower limit of the ATR range, a trading opportunity occurs. At this time, it is necessary to judge the direction. If it is an upward breakthrough, go long. If it is a downward breakthrough, go short. To ensure the breakthrough direction is consistent with the trend direction, the strategy uses the EMA indicator to determine the overall trend direction. Only when the breakthrough direction is consistent with the EMA direction will a position be taken.
Finally, the strategy uses the price breaking through the ATR range again as the closing signal. After going long, close the position when the price falls below the lower limit; after going short, close the position when the price rises above the upper limit.
Strategy Advantages
-
Using the ATR indicator to determine breakthroughs can effectively capture price trend breakthroughs. The ATR range is set based on volatility and will not interfere too much with normal fluctuations.
-
Adding the EMA indicator as a directional judgment avoids trading against the trend direction, which can greatly improve the profit rate.
-
Using the price break back above the ATR range as a stop loss method can maximize risk control.
Strategy Risks
-
In a volatile market, the ATR range may be frequently penetrated, which easily leads to excessive invalid trades and wider losses.
-
The EMA as an indicator for judging trend direction has some lag. So it may miss opportunities for short-term price reversals.
-
The stop loss method is price break back above range, which can easily lead to widened losses due to sudden events.
Strategy Optimization Directions
-
Consider combining other indicators to determine trends and pullbacks to avoid EMA singular judgment errors. Such as MACD, KDJ, etc.
-
Consider adjusting ATR parameters in real time according to market volatility so that the ATR range is closer to the actual fluctuation.
-
Consider incorporating a moving stop loss method to continuously adjust the stop loss point to maximize the risk control of single losses.
Summary
The overall idea of this strategy is clear, using the ATR indicator to determine price breakthroughs and cooperating with EMA to determine direction, it can effectively follow trends; The stop loss method is straightforward and easy to operate. But at the same time, there are certain risks and large room for optimization that need further testing and adjustment. In general, this strategy is suitable for trend traders pursuing high win rates.
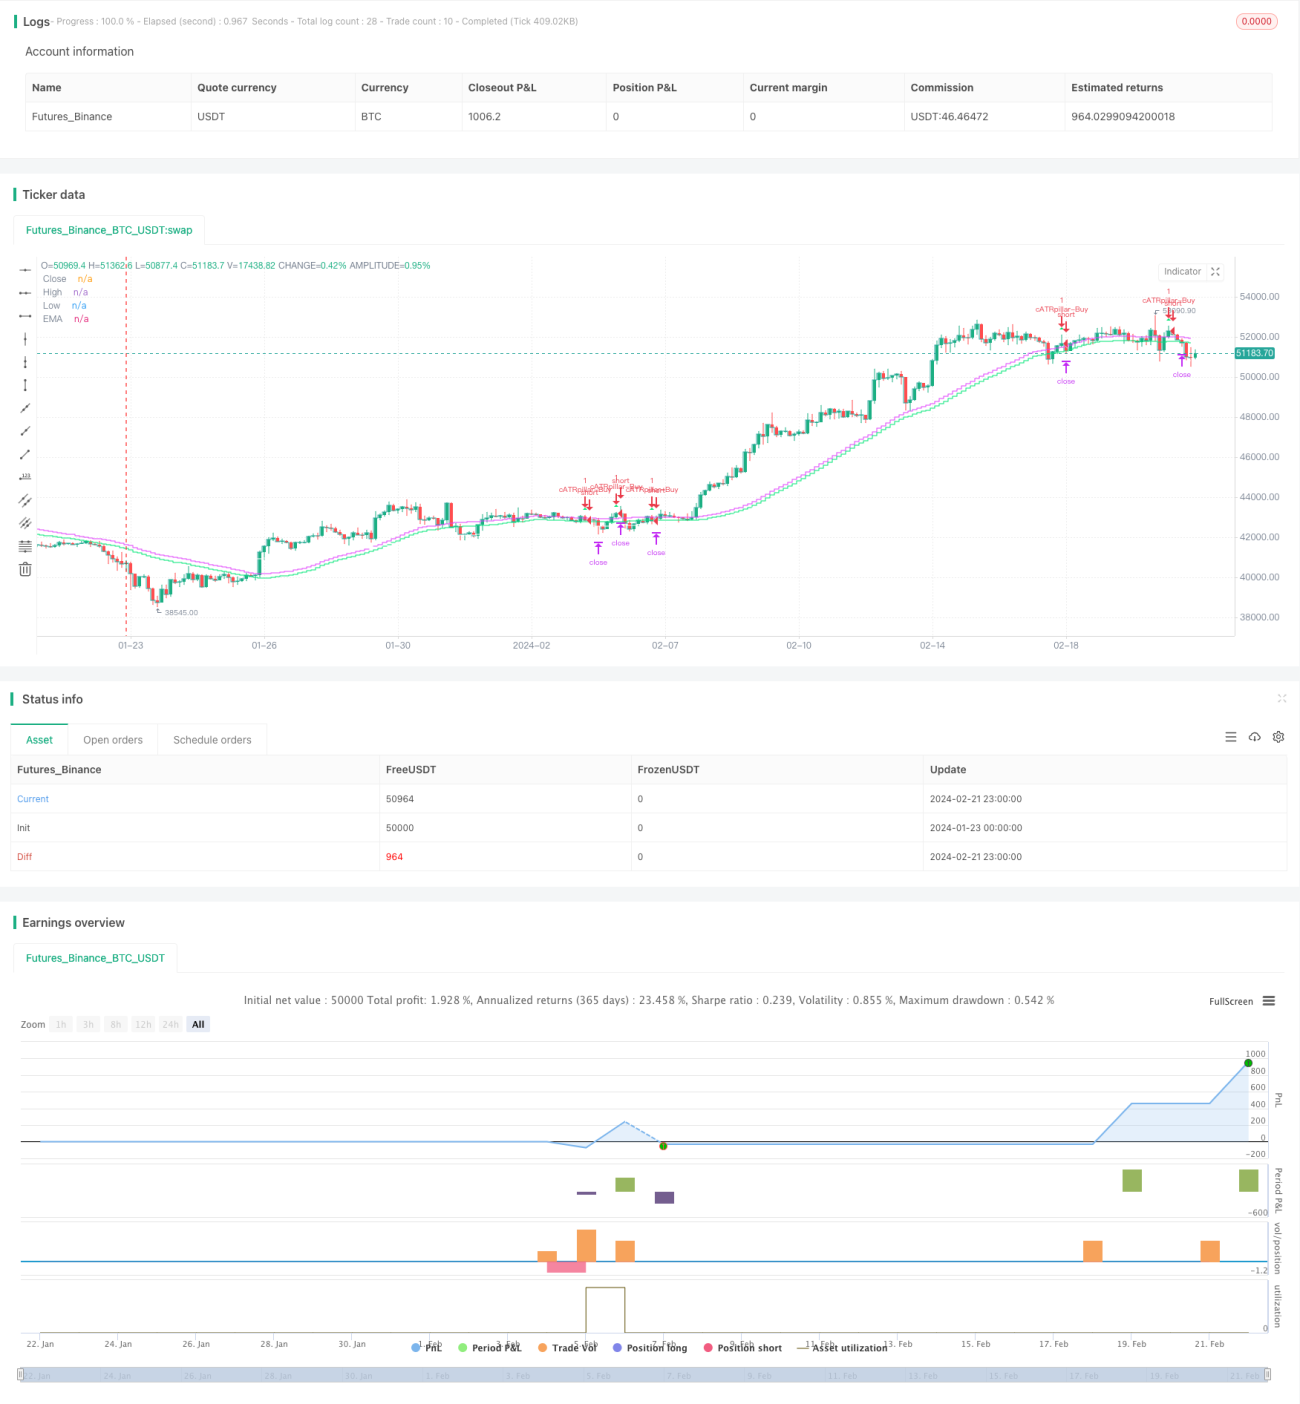
/*backtest
start: 2024-01-23 00:00:00
end: 2024-02-22 00:00:00
period: 3h
basePeriod: 15m
exchanges: [{"eid":"Futures_Binance","currency":"BTC_USDT"}]
*/

// This source code is subject to the terms of the Mozilla Public License 2.0 at https://mozilla.org/MPL/2.0/
// © cwagoner78
//@version=4
strategy("cATRpillar", overlay=true)- 1