Trend Following Strategy Based on Moving Average Crossover

Overview
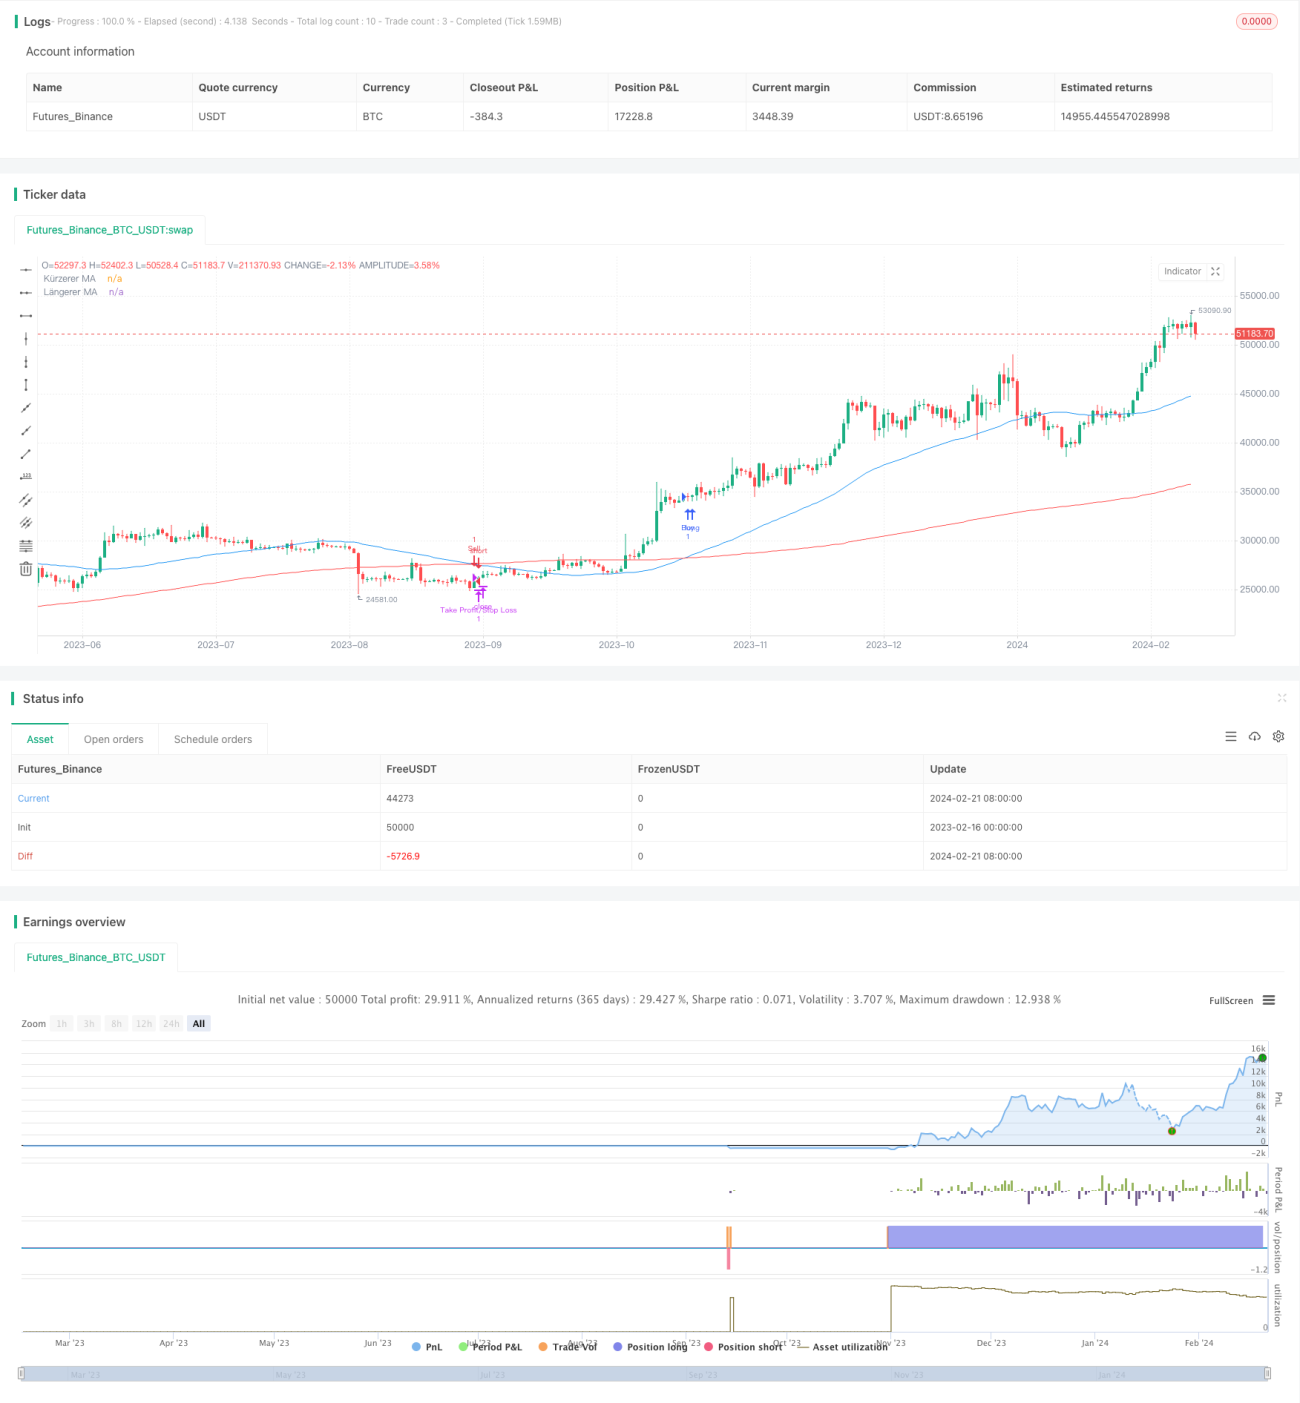
This strategy is designed based on the principle of golden cross and death cross of moving averages. By calculating the crossover situations between the fast line (short-term moving average) and the slow line (long-term moving average), it judges the market trend and realizes trend following. When the fast line breaks through the slow line upward, a buy signal is generated. When the fast line breaks through the slow line downward, a sell signal is generated.
Principle
The strategy mainly relies on the principle of moving average crossover. The fast line parameter is set to 50 days and the slow line parameter is set to 200 days. Calculate the average closing price over the most recent 50 and 200 days respectively as the fast line and slow line. When the fast line breaks through the slow line upward, it is determined that the stock price has entered an upward trend and a buy signal is generated. When the fast line breaks through the slow line downward, it is determined that the stock price has entered a downward trend and a sell signal is generated.
By setting fast and slow line combinations with different parameters, the sensitivity of the strategy can be adjusted. The smaller the fast line parameter, the faster the determination of the trend, but there may be more false signals. The larger the slow line parameter, the better the trend judgment, but the slower the determination of the trend. This strategy uses 50 and 200-day moving averages, comprehensively considering the sensitivity and stability of the strategy.
Advantages
- Effectively determine market trends and inflection points by using moving average crossover principle to automatically track trends
- Reasonable fast and slow line parameter settings make it sensitive enough while filtering noise to effectively determine market trends
- Easy to understand strategy logic and clear parameters setting make it easy to implement and optimize
- Strict stop loss control contributes to risk management
Risks
- Moving average strategies may produce more reversal or false signals, requiring assistance from other indicators for filtering
- Volatile markets may generate wrong trading signals, requiring assessment of fluctuations frequency of specific stocks
- Setting stop loss points needs to take into account the characteristics of individual stocks. Too strict may increase costs while too loose may increase losses
Optimization
- Combine other technical indicators such as MACD and KD to filter false signals
- Set moving average parameters based on characteristics and frequency of fluctuations of individual stocks
- Adjust stop loss distance for highly volatile stocks
- Test different parameter combinations to optimize the strategy
- Increase open positions and add positions rules
Summary
This strategy utilizes the principle of moving average crossover to automatically determine the trend direction of the market and track the trend, which can effectively capture the main trend. By setting parameters of fast and slow moving averages to control the sensitivity of the strategy and filtering signals with other auxiliary indicators, the stability and effectiveness of the strategy can be balanced. This strategy is suitable for medium and long term operations. Parameters can be adjusted according to the characteristics of stocks and markets. Expanding entry and stop loss rules can further optimize it to obtain better trading performance.
- 1