The Order Block Momentum Breakout Strategy

Author: ChaoZhang, Date: 2024-02-26 11:54:02
Tags:

img

Overview

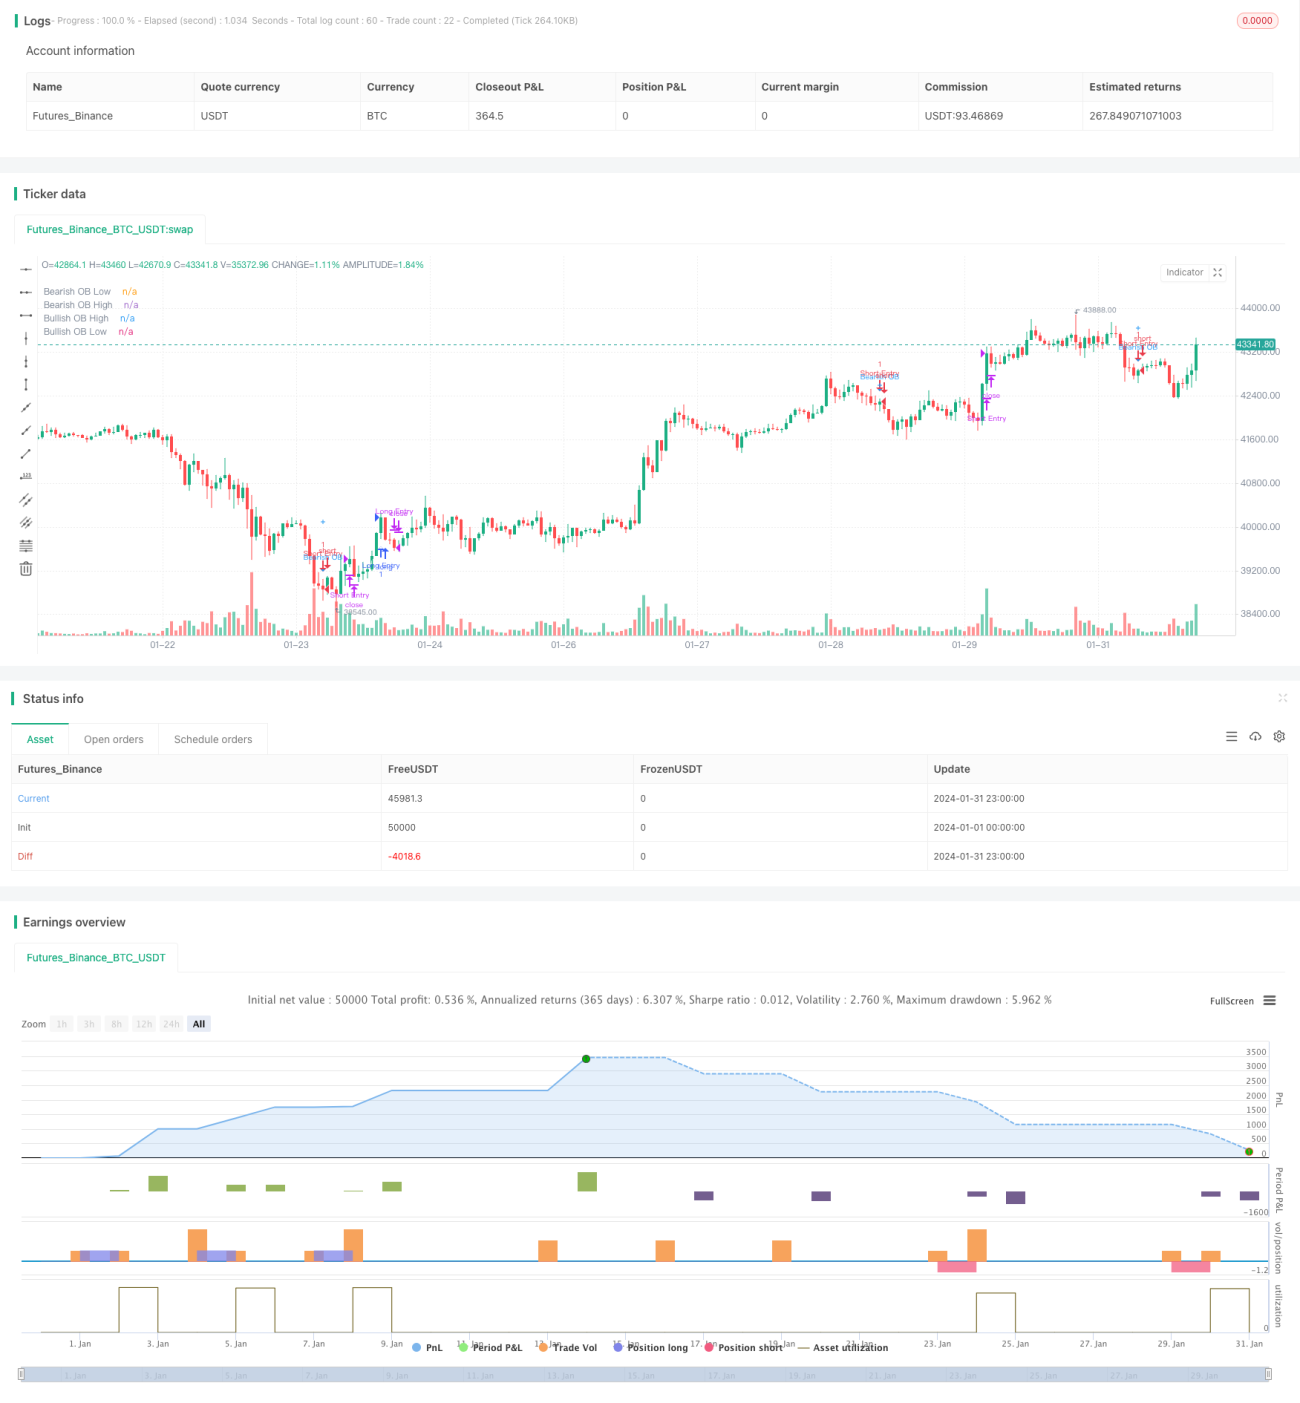
This strategy identifies order blocks in price action to locate momentum bursts and enters the market when buy/sell signals emerge. Order blocks represent institutional participation and significant market forces. Thus order block signals have a higher probability of leading to trending price action.

Strategy Logic

Identifying Order Blocks

There are two types of order blocks - bullish and bearish. A bullish order block is defined as the last red candle followed by consecutive green candles. A bearish order block is the last green candle followed by consecutive red candles.

To identify an order block, the following criteria must be met simultaneously:

  1. Candle color change - The candle color changes from the previous candle to the current one (e.g. from red to green, or green to red). This suggests institutions may be ending the previous trend and initiating a new potential trend.

  2. Consistent direction afterwards - The subsequent candles maintain the same color direction for the number of periods specified in the parameters (e.g. all green candles after a potential bullish block). This confirms the new trend.

  3. Breakout exceeds threshold - The percentage price change from the open of the order block candle to the close of the final confirmation candle exceeds the threshold parameter (default 0). This ensures strong enough momentum.

When all three criteria are true, an order block signal is identified.

Generating Trading Signals

A buy signal is generated when detecting a bullish order block. A sell signal emerges when a bearish order block is identified.

Considering the uncertainty of order flow signals, the strategy does not immediately enter the market. It alerts the trader and allows price limit orders to be placed near the order block levels instead. This provides controlled entries and risk management.

Advantages

Captures hidden momentum

Order blocks represent institutional money flow and substantial volume. They indicate shifts in market forces and provide early clues into potential breakout direction. This facilitates trend following with good timing.

Customizable parameters

The parameters controlling candle count, breakout percentage etc. can be adjusted to optimize for changing market conditions and trading style. This enhances adaptability.

Controlled risk

By not auto-entering on signals and using limit orders instead, traders can define entry levels and control risk. Failed signals simply lead to unfilled limit orders. Risks are contained.

Risks

High retest probability

As order blocks signify zones, prices revisiting the level is common. Signals should not be viewed as direct entries. Further timing judgement is needed.

Parameter misfit causes bad signals

If parameters are not set properly, fake signals can emerge in range-bound markets. Traders need to exercise discretion in applying signals. Blind optimization should be avoided.

Manual review is necessary

With each signal requiring further validation, significant manual effort is involved. Inconsistencies in human discretion on signal quality may lead to performance divergence.

Enhancement Opportunities

Signal filtering with other indicators

Incorporate additional indicators like MACD and RSI when signals appear to gauge market conditions. This filters bad signals from poor parameter settings.

Parameter optimization

The parameters can be tested and tuned to suit different markets and instruments for better fit. Adaptive settings can also be implemented to auto-adjust based on volatility and risk tolerance.

Automated entry/exit

Currently the strategy only serves as signal alerts. Logics can be added to automate limit order entries on signals and implement stops for exits. This increases automation and reduces reliance on human judgement.

Conclusion

By detecting order flow convergence, this strategy reveals hidden momentum moves brewing under the surface. Compared to simple trend following, it has predictive abilities in locating turning points. When combined with optimization and risk control techniques, it can become an effective trend trading system. Nonetheless, traders should be wary of bad signals and assess each signal’s quality. Further efforts should focus on enhancing automation to minimize biases from subjective discretion.


/*backtest
start: 2024-01-01 00:00:00
end: 2024-01-31 23:59:59
period: 1h
basePeriod: 15m
exchanges: [{"eid":"Futures_Binance","currency":"BTC_USDT"}]
*/

// This source code is subject to the terms of the Mozilla Public License 2.0 at https://mozilla.org/MPL/2.0/
// © TradingSecrets and wugamlo


// This experimental Indicator helps identifying instituational Order Blocks. 
// Often these blocks signal the beginning of a strong move, but there is a significant probability that these price levels will be revisited at a later point in time again. 
// Therefore these are interesting levels to place limit orders (Buy Orders for Bullish OB / Sell Orders for Bearish OB). 
//
// A Bullish Order block is defined as the last down candle before a sequence of up candles. (Relevant price range "Open" to "Low" is marked)  / Optionally full range "High" to "Low"
// A Bearish Order Block is defined as the last up candle before a sequence of down candles. (Relevant price range "Open" to "High" is marked) / Optionally full range "High" to "Low"
//
// In the settings the number of required sequential candles can be adjusted. 
// Furthermore a %-threshold can be entered. It defines which %-change the sequential move needs to achieve in order to identify a relevant Order Block. 
// Channels for the last Bullish/Bearish Block can be shown/hidden.
//
// In addition to the upper/lower limits of each Order Block, also the equlibrium (average value) is marked as this is an interesting area for price interaction.
//
// Alerts added: Alerts fire when an Order Block is detected. The delay is based on the "Relevant Periods" input. Means with the default setting "5" the alert will trigger after the 
// number of consecutive candles is reached.


//@version=4
strategy("[Backtest] Order Block Finder", overlay = true)               

colors    = input(title = "Color Scheme", defval="DARK", options=["DARK", "BRIGHT"])
periods   = input(5,     "Relevant Periods to identify OB")                // Required number of subsequent candles in the same direction to identify Order Block
threshold = input(0.0,   "Min. Percent move to identify OB", step = 0.1)   // Required minimum % move (from potential OB close to last subsequent candle to identify Order Block)
usewicks  = input(false, "Use whole range [High/Low] for OB marking?" )    // Display High/Low range for each OB instead of Open/Low for Bullish / Open/High for Bearish
showbull  = input(false,  "Show latest Bullish Channel?")                   // Show Channel for latest Bullish OB?
showbear  = input(false,  "Show latest Bearish Channel?")                   // Show Channel for latest Bearish OB?
showdocu  = input(false, "Show Label for documentation tooltip?")          // Show Label which shows documentation as tooltip?
info_pan  = input(false, "Show Latest OB Panel?")                          // Show Info Panel with latest OB Stats
//strategy inputs
plot_offset = input( type=input.bool,defval = false, title = 'Plot Offset?')
stoploss_percent = input(type=input.float, defval = 1, title = 'Stop Loss [%]')
takeprofit_percent = input(type=input.float, defval = 2, title = 'Take Profit [%]')
pyramiding = input( type=input.bool,defval = true, title = 'Pyramiding')

ob_period = periods + 1                                                    // Identify location of relevant Order Block candle
absmove   = ((abs(close[ob_period] - close[1]))/close[ob_period]) * 100    // Calculate absolute percent move from potential OB to last candle of subsequent candles
relmove   = absmove >= threshold                                           // Identify "Relevant move" by comparing the absolute move to the threshold

// Color Scheme
bullcolor = colors == "DARK"? color.white : color.green
bearcolor = colors == "DARK"? color.blue : color.red

// Bullish Order Block Identification
bullishOB = close[ob_period] < open[ob_period]                             // Determine potential Bullish OB candle (red candle)

int upcandles  = 0
for i = 1 to periods
    upcandles := upcandles + (close[i] > open[i]? 1 : 0)                   // Determine color of subsequent candles (must all be green to identify a valid Bearish OB)

OB_bull      = bullishOB and (upcandles == (periods)) and relmove          // Identification logic (red OB candle & subsequent green candles)
OB_bull_high = OB_bull? usewicks? high[ob_period] : open[ob_period] : na   // Determine OB upper limit (Open or High depending on input)
OB_bull_low  = OB_bull? low[ob_period]  : na                               // Determine OB lower limit (Low)
OB_bull_avg  = (OB_bull_high + OB_bull_low)/2                              // Determine OB middle line


// Bearish Order Block Identification
bearishOB = close[ob_period] > open[ob_period]                             // Determine potential Bearish OB candle (green candle)

int downcandles  = 0
for i = 1 to periods
    downcandles := downcandles + (close[i] < open[i]? 1 : 0)               // Determine color of subsequent candles (must all be red to identify a valid Bearish OB)

OB_bear      = bearishOB and (downcandles == (periods)) and relmove        // Identification logic (green OB candle & subsequent green candles)
OB_bear_high = OB_bear? high[ob_period] : na                               // Determine OB upper limit (High)
OB_bear_low  = OB_bear? usewicks? low[ob_period] : open[ob_period] : na    // Determine OB lower limit (Open or Low depending on input)
OB_bear_avg  = (OB_bear_low + OB_bear_high)/2                              // Determine OB middle line

//@TradingSecrets: Option to disable the offset in order to allign signals with Backtest
if not plot_offset
    ob_period := 0
// Plotting
plotshape(OB_bull, title="Bullish OB", style = shape.triangleup,   color = bullcolor, textcolor = bullcolor, size = size.tiny, location = location.belowbar, offset = -ob_period, text = "Bullish OB")     // Bullish OB Indicator
bull1 = plot(OB_bull_high, title="Bullish OB High", style = plot.style_linebr, color = bullcolor, offset = -ob_period, linewidth = 3)                                               // Bullish OB Upper Limit
bull2 = plot(OB_bull_low,  title="Bullish OB Low",  style = plot.style_linebr, color = bullcolor, offset = -ob_period, linewidth = 3)                                               // Bullish OB Lower Limit
fill(bull1, bull2, color=bullcolor, transp = 0, title = "Bullish OB fill")                                                                                                          // Fill Bullish OB
plotshape(OB_bull_avg, title="Bullish OB Average", style = shape.cross,   color = bullcolor, size = size.normal, location = location.absolute, offset = -ob_period)                 // Bullish OB Average


plotshape(OB_bear, title="Bearish OB", style = shape.triangledown, color = bearcolor, textcolor = bearcolor,  size = size.tiny, location = location.abovebar, offset = -ob_period, text = "Bearish OB")     // Bearish OB Indicator
bear1 = plot(OB_bear_low,  title="Bearish OB Low",  style = plot.style_linebr, color = bearcolor, offset = -ob_period, linewidth = 3)                                                // Bearish OB Lower Limit
bear2 = plot(OB_bear_high, title="Bearish OB High", style = plot.style_linebr, color = bearcolor, offset = -ob_period, linewidth = 3)                                                // Bearish OB Upper Limit
fill(bear1, bear2, color=bearcolor, transp = 0, title = "Bearish OB fill")                                                                                                           // Fill Bearish OB
plotshape(OB_bear_avg, title="Bearish OB Average", style = shape.cross,   color = bearcolor, size = size.normal, location = location.absolute, offset = -ob_period)                  // Bullish OB Average

var line linebull1 = na       // Bullish OB average 
var line linebull2 = na       // Bullish OB open
var line linebull3 = na       // Bullish OB low
var line linebear1 = na       // Bearish OB average
var line linebear2 = na       // Bearish OB high
var line linebear3 = na       // Bearish OB open


if OB_bull and showbull
    line.delete(linebull1)
    linebull1 := line.new(x1 = bar_index, y1 = OB_bull_avg, x2 = bar_index - 1, y2 = OB_bull_avg, extend = extend.left, color = bullcolor, style = line.style_solid, width = 1)
    
    line.delete(linebull2)
    linebull2 := line.new(x1 = bar_index, y1 = OB_bull_high, x2 = bar_index - 1, y2 = OB_bull_high, extend = extend.left, color = bullcolor, style = line.style_dashed, width = 1)
    
    line.delete(linebull3)
    linebull3 := line.new(x1 = bar_index, y1 = OB_bull_low, x2 = bar_index - 1, y2 = OB_bull_low, extend = extend.left, color = bullcolor, style = line.style_dashed, width = 1)

if OB_bear and showbear
    line.delete(linebear1)
    linebear1 := line.new(x1 = bar_index, y1 = OB_bear_avg, x2 = bar_index - 1, y2 = OB_bear_avg, extend = extend.left, color = bearcolor,  style = line.style_solid, width = 1)
    
    line.delete(linebear2)
    linebear2 := line.new(x1 = bar_index, y1 = OB_bear_high, x2 = bar_index - 1, y2 = OB_bear_high, extend = extend.left, color = bearcolor,  style = line.style_dashed, width = 1)
    
    line.delete(linebear3)
    linebear3 := line.new(x1 = bar_index, y1 = OB_bear_low, x2 = bar_index - 1, y2 = OB_bear_low, extend = extend.left, color = bearcolor,  style = line.style_dashed, width = 1)


// Alerts for Order Blocks Detection

alertcondition(OB_bull, title='New Bullish OB detected', message='New Bullish OB detected - This is NOT a BUY signal!')
alertcondition(OB_bear, title='New Bearish OB detected', message='New Bearish OB detected - This is NOT a SELL signal!')

// Print latest Order Blocks in Data Window

var latest_bull_high = 0.0         // Variable to keep latest Bull OB high
var latest_bull_avg  = 0.0         // Variable to keep latest Bull OB average
var latest_bull_low  = 0.0         // Variable to keep latest Bull OB low
var latest_bear_high = 0.0         // Variable to keep latest Bear OB high
var latest_bear_avg  = 0.0         // Variable to keep latest Bear OB average
var latest_bear_low  = 0.0         // Variable to keep latest Bear OB low

// Assign latest values to variables
if OB_bull_high > 0
    latest_bull_high := OB_bull_high

if OB_bull_avg > 0
    latest_bull_avg := OB_bull_avg

if OB_bull_low > 0
    latest_bull_low := OB_bull_low

if OB_bear_high > 0
    latest_bear_high := OB_bear_high
    
if OB_bear_avg > 0
    latest_bear_avg := OB_bear_avg
    
if OB_bear_low > 0
    latest_bear_low := OB_bear_low

// Plot invisible characters to be able to show the values in the Data Window
plotchar(latest_bull_high, char = ' ', location = location.abovebar, color = #777777, transp = 100, size = size.tiny, title = "Latest Bull High")
plotchar(latest_bull_avg,  char = ' ', location = location.abovebar, color = #777777, transp = 100, size = size.tiny, title = "Latest Bull Avg")
plotchar(latest_bull_low,  char = ' ', location = location.abovebar, color = #777777, transp = 100, size = size.tiny, title = "Latest Bull Low")
plotchar(latest_bear_high, char = ' ', location = location.abovebar, color = #777777, transp = 100, size = size.tiny, title = "Latest Bear High")
plotchar(latest_bear_avg,  char = ' ', location = location.abovebar, color = #777777, transp = 100, size = size.tiny, title = "Latest Bear Avg")
plotchar(latest_bear_low,  char = ' ', location = location.abovebar, color = #777777, transp = 100, size = size.tiny, title = "Latest Bear Low")


//InfoPanel for latest Order Blocks

draw_InfoPanel(_text, _x, _y, font_size)=>
    var label la_panel = na
    label.delete(la_panel)
    la_panel := label.new(
         x=_x, y=_y, 
         text=_text, xloc=xloc.bar_time, yloc=yloc.price, 
         color=color.new(#383838, 5), style=label.style_label_left, textcolor=color.white, size=font_size)

info_panel_x = time_close + round(change(time) * 100)
info_panel_y = close

title = "LATEST ORDER BLOCKS"
row0 = "-----------------------------------------------------"
row1 = ' Bullish - High: ' + tostring(latest_bull_high, '#.##')
row2 = ' Bullish - Avg: ' + tostring(latest_bull_avg, '#.##')
row3 = ' Bullish - Low: ' + tostring(latest_bull_low, '#.##')
row4 = "-----------------------------------------------------"
row5 = ' Bearish - High: ' + tostring(latest_bear_high, '#.##')
row6 = ' Bearish - Avg: ' + tostring(latest_bear_avg, '#.##')
row7 = ' Bearish - Low: ' + tostring(latest_bear_low, '#.##')

panel_text = '\n' + title + '\n' + row0 + '\n' + row1 + '\n' + row2 + '\n' + row3 + '\n' + row4 + '\n\n' + row5 + '\n' + row6 + '\n' + row7 + '\n'

if info_pan
    draw_InfoPanel(panel_text, info_panel_x, info_panel_y, size.normal)


// === Label for Documentation/Tooltip ===
chper = time - time[1]
chper := change(chper) > 0 ? chper[1] : chper

// === Tooltip text ===

var vartooltip = "Indicator to help identifying instituational Order Blocks. Often these blocks signal the beginning of a strong move, but there is a high probability, that these prices will be revisited at a later point in time again and therefore are interesting levels to place limit orders. \nBullish Order block is the last down candle before a sequence of up candles. \nBearish Order Block is the last up candle before a sequence of down candles. \nIn the settings the number of required sequential candles can be adjusted. \nFurthermore a %-threshold can be entered which the sequential move needs to achieve in order to validate a relevant Order Block. \nChannels for the last Bullish/Bearish Block can be shown/hidden."

// === Print Label ===
var label l_docu = na
label.delete(l_docu)

if showdocu
    l_docu := label.new(x = time + chper * 35, y = close, text = "DOCU OB", color=color.gray, textcolor=color.white, style=label.style_label_center, xloc = xloc.bar_time, yloc=yloc.price, size=size.tiny, textalign = text.align_left, tooltip = vartooltip)

// @TradingSecrets: Generate entry and exit orders based on the signals
entryLongSignal = OB_bull
entryShortSignal = OB_bear

if not pyramiding
    entryLongSignal := entryLongSignal and not strategy.position_size
    entryShortSignal := entryShortSignal and not strategy.position_size
if entryLongSignal
    strategy.entry("Long Entry", strategy.long)
    //strategy.exit("Long Exit Loss", "Long Entry", stop = close * (1 - stoploss_percent*0.01))

if entryShortSignal
    strategy.entry("Short Entry", strategy.short)
    //strategy.exit("Short Exit Loss", "Short Entry", stop = close * (1 + stoploss_percent*0.01))
strategy.initial_capital = 50000        
//Close Position by market order
if strategy.position_size > 0 and strategy.openprofit/nz(strategy.initial_capital + strategy.netprofit) >= takeprofit_percent*0.01
    //If I m in a long position and my take profit got hit close it by market order
    strategy.close("Long Entry", comment = "Long Exit Profit")
if strategy.position_size < 0 and strategy.openprofit/nz(strategy.initial_capital + strategy.netprofit) >= takeprofit_percent*0.01
    strategy.close("Short Entry", comment = "Short Exit Profit")

if strategy.position_size > 0 and strategy.openprofit/nz(strategy.initial_capital + strategy.netprofit) <= -stoploss_percent*0.01
    //If I m in a long position and my take profit got hit close it by market order
    strategy.close("Long Entry", comment = "Long Exit Loss")
if strategy.position_size < 0 and strategy.openprofit/nz(strategy.initial_capital + strategy.netprofit) <= -stoploss_percent*0.01
    strategy.close("Short Entry", comment = "Short Exit Loss")

More