Gold Standard Quantitative Trading Strategy

Overview
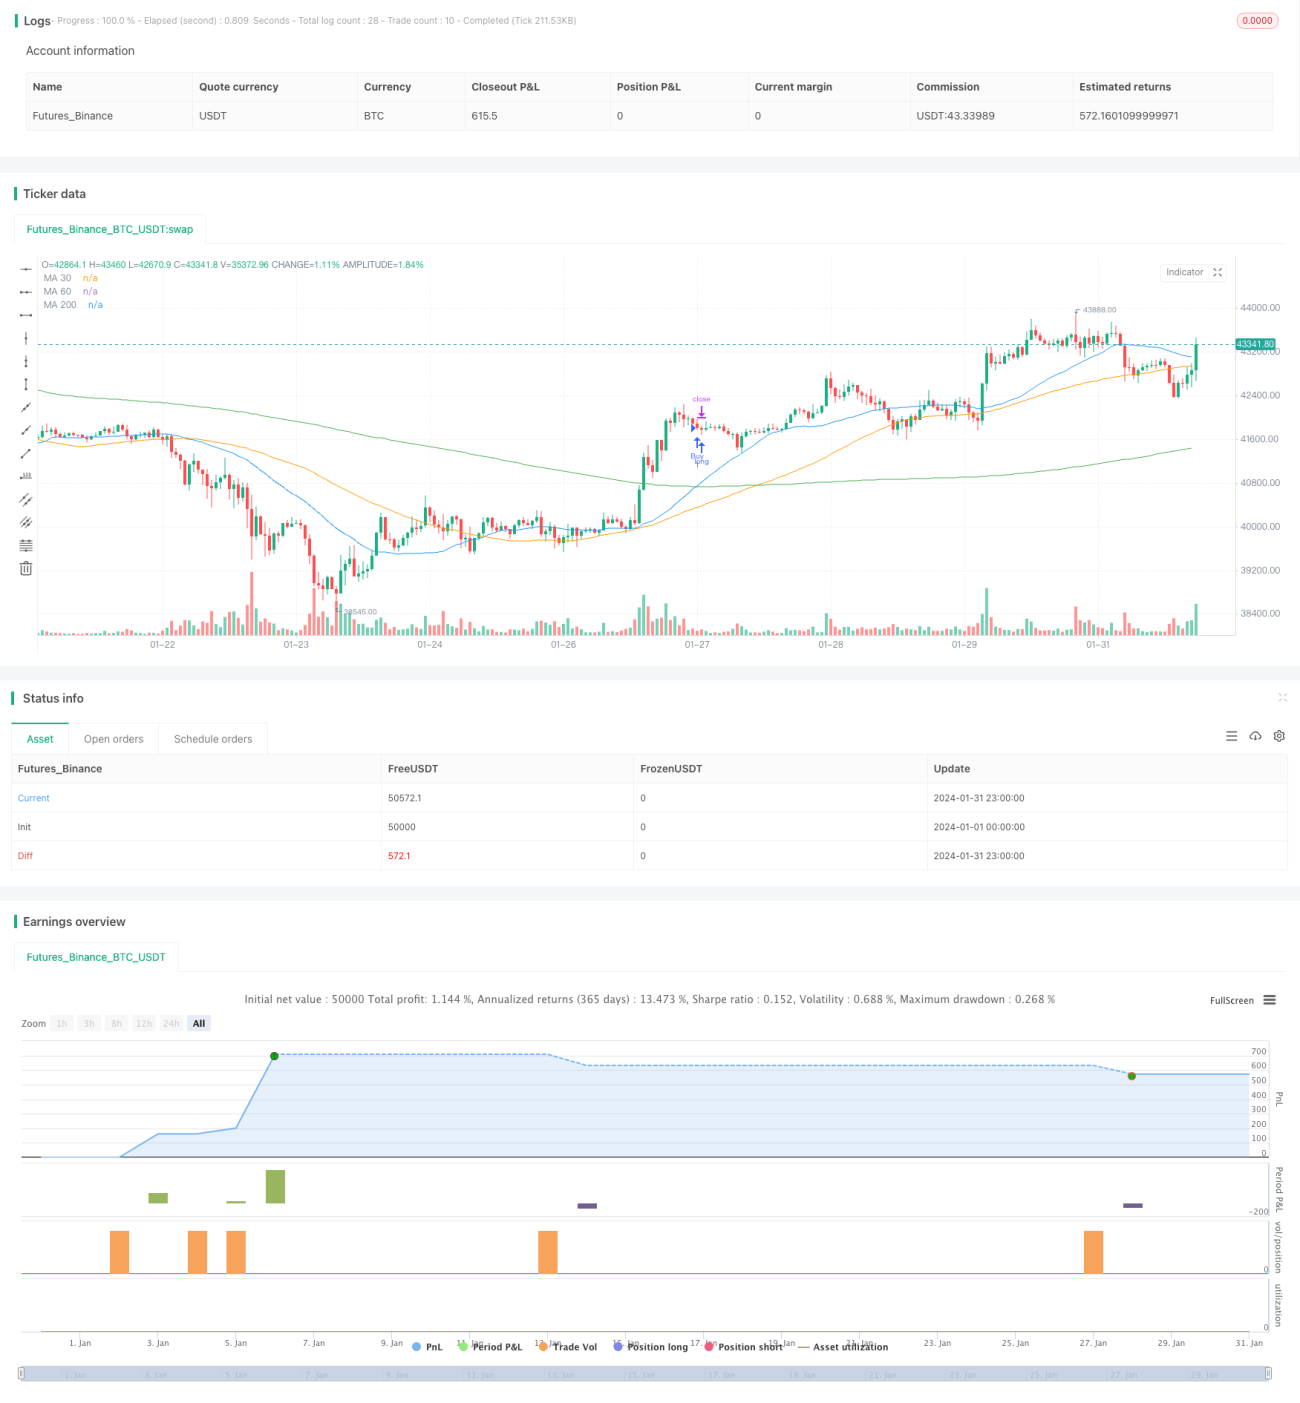
This strategy is a trading strategy based on the crossover of the 30-day and 200-day moving averages. It runs on the XAUUSD gold 1-minute chart to capture short-term price trends. The strategy also uses stop loss and take profit settings to manage risk.
Strategy Principle
The strategy uses the crossover of the 30-day and 200-day moving averages as trading signals. It goes long when the 30-day moving average crosses above the 200-day moving average, and goes short when the 30-day moving average crosses below the 200-day moving average. In addition, when a reverse signal appears, the current position will be closed, and a new position will be opened according to the direction of the new signal.
The strategy combines the advantages of trend tracking and moving average crossover. The 30-day MA can respond to price changes faster, while the 200-day MA has stronger trend filtering. Their crossover provides clear signals for entering and exiting the market. At the same time, it uses reverse opening to lock in profits and avoid large losses during price consolidation.
Advantage Analysis
- Improves signal reliability by using double moving average crossover
- Reverse opening mechanism helps avoid losses caused by consolidation
- Setting stop loss and take profit is beneficial for risk control
- Can be used in multiple time frames
- Easy to improve effectiveness through parameter optimization
Risk Analysis
The main risks facing this strategy are:
- Higher probability of false signals from double MAs, may cause frequent trading, increasing trading costs and slippage risks
- Ignores underlying fundamentals of trading instrument, overlooks inherent logic of price fluctuations
- No capital management rules set to control per trade risk exposure
Risks can be reduced by:
- Adding filters to avoid frequent signal reversal
- Combining fundamental analysis of trading instrument
- Introducing capital management module to limit per trade position sizing
Optimization Directions
The strategy can be optimized in the following aspects:
- Test different parameter combinations of MAs to find the optimal parameters
- Add other indicators for filtration, such as volume, volatility indicators, etc.
- Introduce adaptive stop loss mechanism to adjust stops based on market volatility
- Implement capital management rules to limit per trade position sizes
- Conduct backtesting optimization to find optimal parameter combinations
Conclusion
The overall operation of the strategy is smooth and the core trading logic is clear and simple. It generates trading signals using double MA crossovers, and uses reverse opening to lock in profits. This trading method can avoid significant losses during price consolidation. Setting stop loss and take profit also facilitates risk control. However, the strategy also has some flaws, mainly manifested as frequent signals while overlooking price fluctuation fundamentals. By introducing filtration conditions, capital management modules, and parameter optimization, risks can be reduced and the stability and profitability of the strategy can be improved.
- 1