RSI Indicator Long Short Separation Trading Strategy

Overview
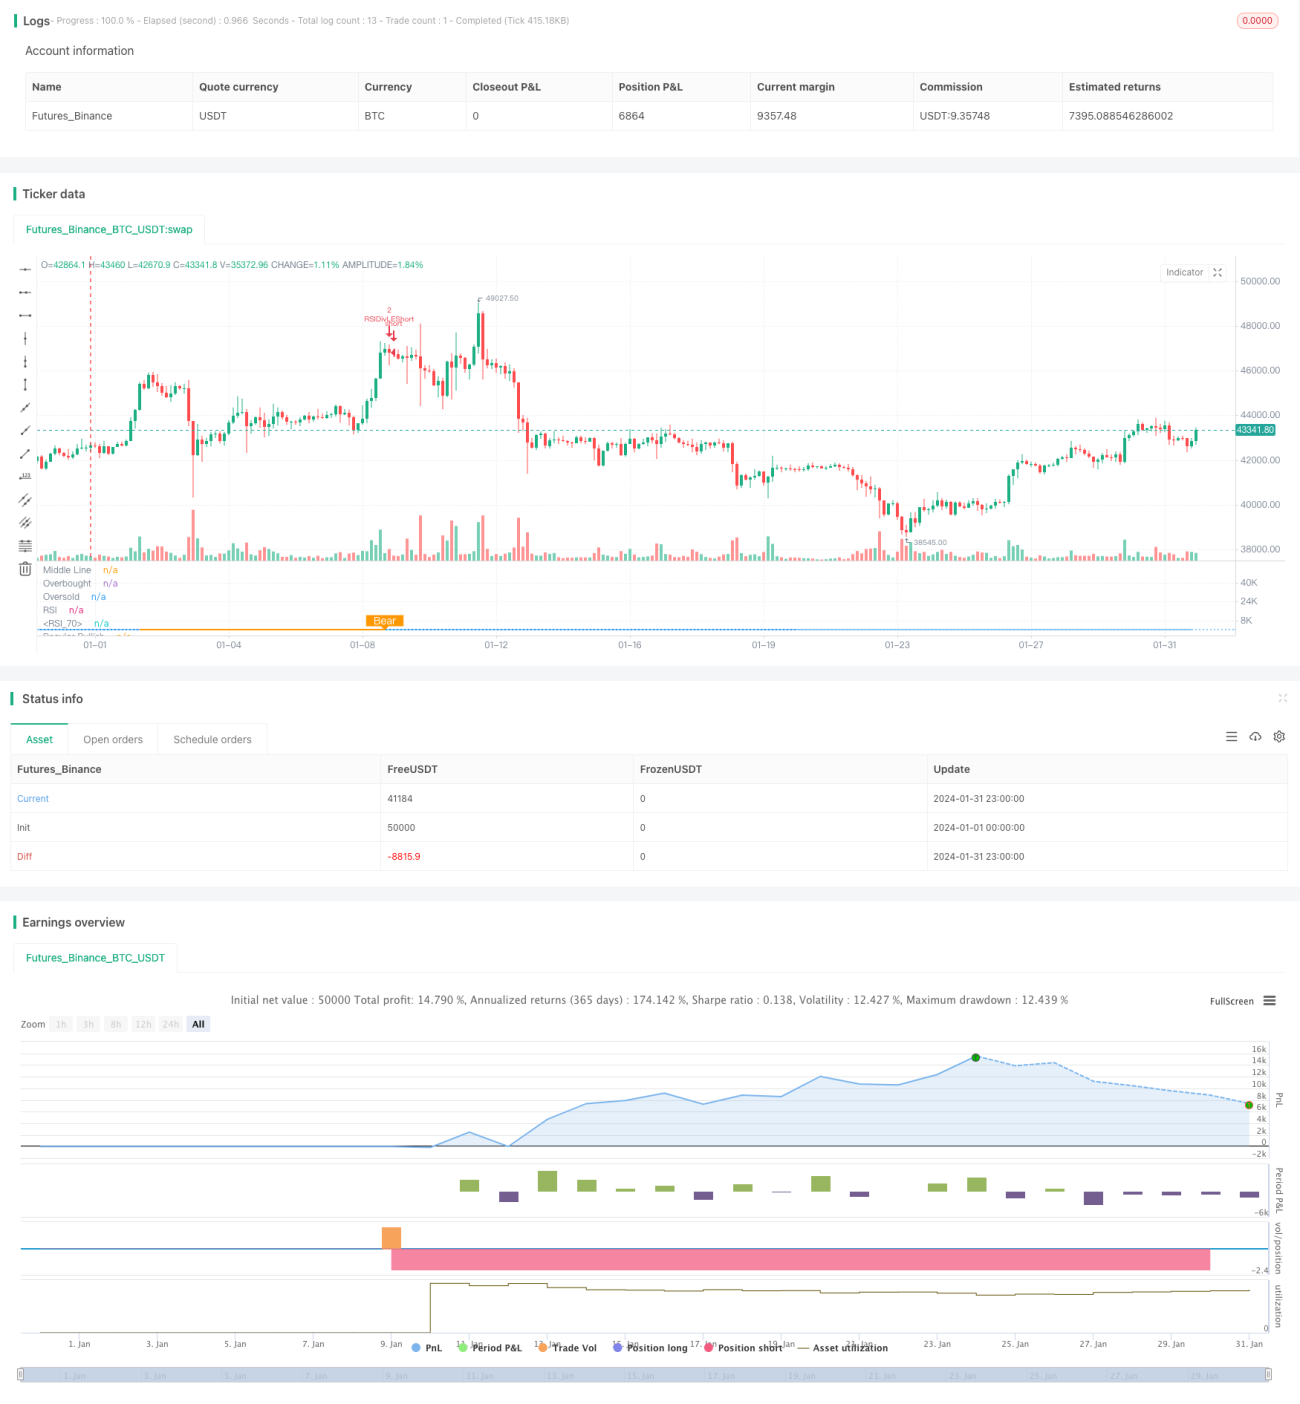
This strategy identifies long short separation phenomena through the RSI indicator to make trading decisions. The core idea is that when prices hit new lows but the RSI indicator hits new highs, a "bullish separation" signal is generated, indicating that the bottom has formed and going long. When prices hit new highs but the RSI indicator hits new lows, a "bearish separation" signal is generated, indicating that the top has formed and going short.
Strategy Principles
The strategy mainly uses the RSI indicator to identify the long short separation between prices and the RSI. The specific method is as follows:
- Use RSI indicator parameters of 13 and close prices as source data
- Define left lookback range for bullish separation as 14 days and right lookback range as 2 days
- Define left lookback range for bearish separation as 47 days and right lookback range as 1 day
- When prices hit lower lows but RSI hits higher lows, long separation condition is met to generate long signals
- When prices hit higher highs but RSI hits lower highs, short separation condition is met to generate short signals
By identifying the long short separation between prices and RSI, it can capture the inflection points of price trends in advance for trade decision making.
Advantages of the Strategy
The main advantages of this strategy are:
- Identifying price/RSI separation can judge trend inflections early to capture trading opportunities
- Use indicator analysis so less affected by emotions
- Use fixed lookback periods to identify separation, avoiding frequent parameter tuning
- Additional conditions like daily RSI reduce false signals
Risks and Solutions
There are still some risks:
-
RSI divergence does not necessarily mean immediate reversal, time lag may exist leading to stop loss risk. Solution is to allow wider stops to give time for divergence signal confirmation.
-
Prolonged separation also increases risk. Solution is to add longer-term daily or weekly RSI as filter conditions.
-
Small divergence may not confirm trend reversal, need to expand lookback periods to find more significant RSI divergence.
Optimization Directions
The strategy can be improved in the following aspects:
-
Optimize RSI parameters to find best parameter combinations
-
Try other technical indicators like MACD, KD to identify separation
-
Add oscillation filters to reduce false signals in choppy periods
-
Combine RSI from multiple timeframes to find best combination signals
Conclusion
The RSI long short separation trading strategy judges trend inflections by identifying divergence between price and RSI to generate trading signals. The strategy is simple and practical. Further improving parameters and adding filters can increase profitability. Overall an effective quantitative trading strategy.
- 1