The Dual EMA Price Swing Strategy

Overview
The Dual EMA Price Swing strategy judges market sentiment and momentum by calculating the difference between two EMAs of different periods. An up-crossing of the difference value above 0 is a bullish signal. A down-crossing below 0 is a bearish signal.
The strategy is simple and easy to use, judging market momentum and direction through EMA difference. However, it also has some laggingness and cannot timely capture turning points.
Principle
The core indicator of the Dual EMA Price Swing strategy is APO, namely Absolute Price Oscillator, representing the difference between two EMAs. Its formula is:
APO = EMA(short period) − EMA(long period)
Specifically, the APO in this strategy is calculated as:
            xShortEMA = ema(close price, LengthShortEMA)

xLongEMA = ema(close price, LengthLongEMA)

xAPO = xShortEMA − xLongEMA
Where LengthShortEMA and LengthLongEMA represent the cycle lengths of the short-term and long-term EMAs respectively.
Several key judgment rules of APO:
- An up-crossing of APO above 0 is a bullish signal
- A down-crossing of APO below 0 is a bearish signal
- A positive APO indicates a current bull state
- A negative APO indicates a current bear state
Determine market sentiment and entry timing based on the real-time value of APO.
Advantage Analysis
The Dual EMA Price Swing Strategy has the following main advantages:
- Using exponential moving average can effectively smooth price data and reduce noise impact
- The APO indicator combines two EMAs to judge both price trend and market momentum
- The strategy signal is simple and clear, easy to determine and implement
- Customizable EMA cycles adapt to different varieties and trading styles
- Reversible signals apply to reverse and short trading
Risk Analysis
The Dual EMA Price Swing Strategy also has some risks, mainly in:
- EMA itself has laggingness and cannot capture price turning points in time
- Default parameters may not apply to all varieties, parameters need optimization
- Frequent signals tend to produce false signals
- Unable to determine stop loss and take profit after opening position
- There is certain lag, possibly missing the best entry timing
We can cope with and reduce these risks by applying reasonable stop loss to reduce single loss; optimizing parameters to adapt cycles; combining other indicators to filter signals and improve strategy stability.
Optimization Directions
The Dual EMA Price Swing Strategy can be optimized in the following aspects:
- Optimize EMA cycle parameters, test combinations of length 5 to 60 to find optimum
- Add other indicators like MA, KDJ, MACD to set filter conditions and avoid false signals
- Use Bollinger Bands, KD to determine reasonable stop loss and take profit
- Combine trend index to judge price trend, avoid trading against trend
- Add trading volume indicator to ensure signals with volume support
- Set re-entry conditions to reduce transactions and trading frequency
Conclusion
In summary, the Dual EMA Price Swing Strategy judges market sentiment by calculating the APO difference between two EMAs. The strategy signal is simple and practical, but also has some drawbacks. We can optimize it through parameter tuning, adding filters, setting stops and more. Easy to use for beginners, also with great potential for expansions. Suitable for quant trading learners to study and apply.
/*backtest
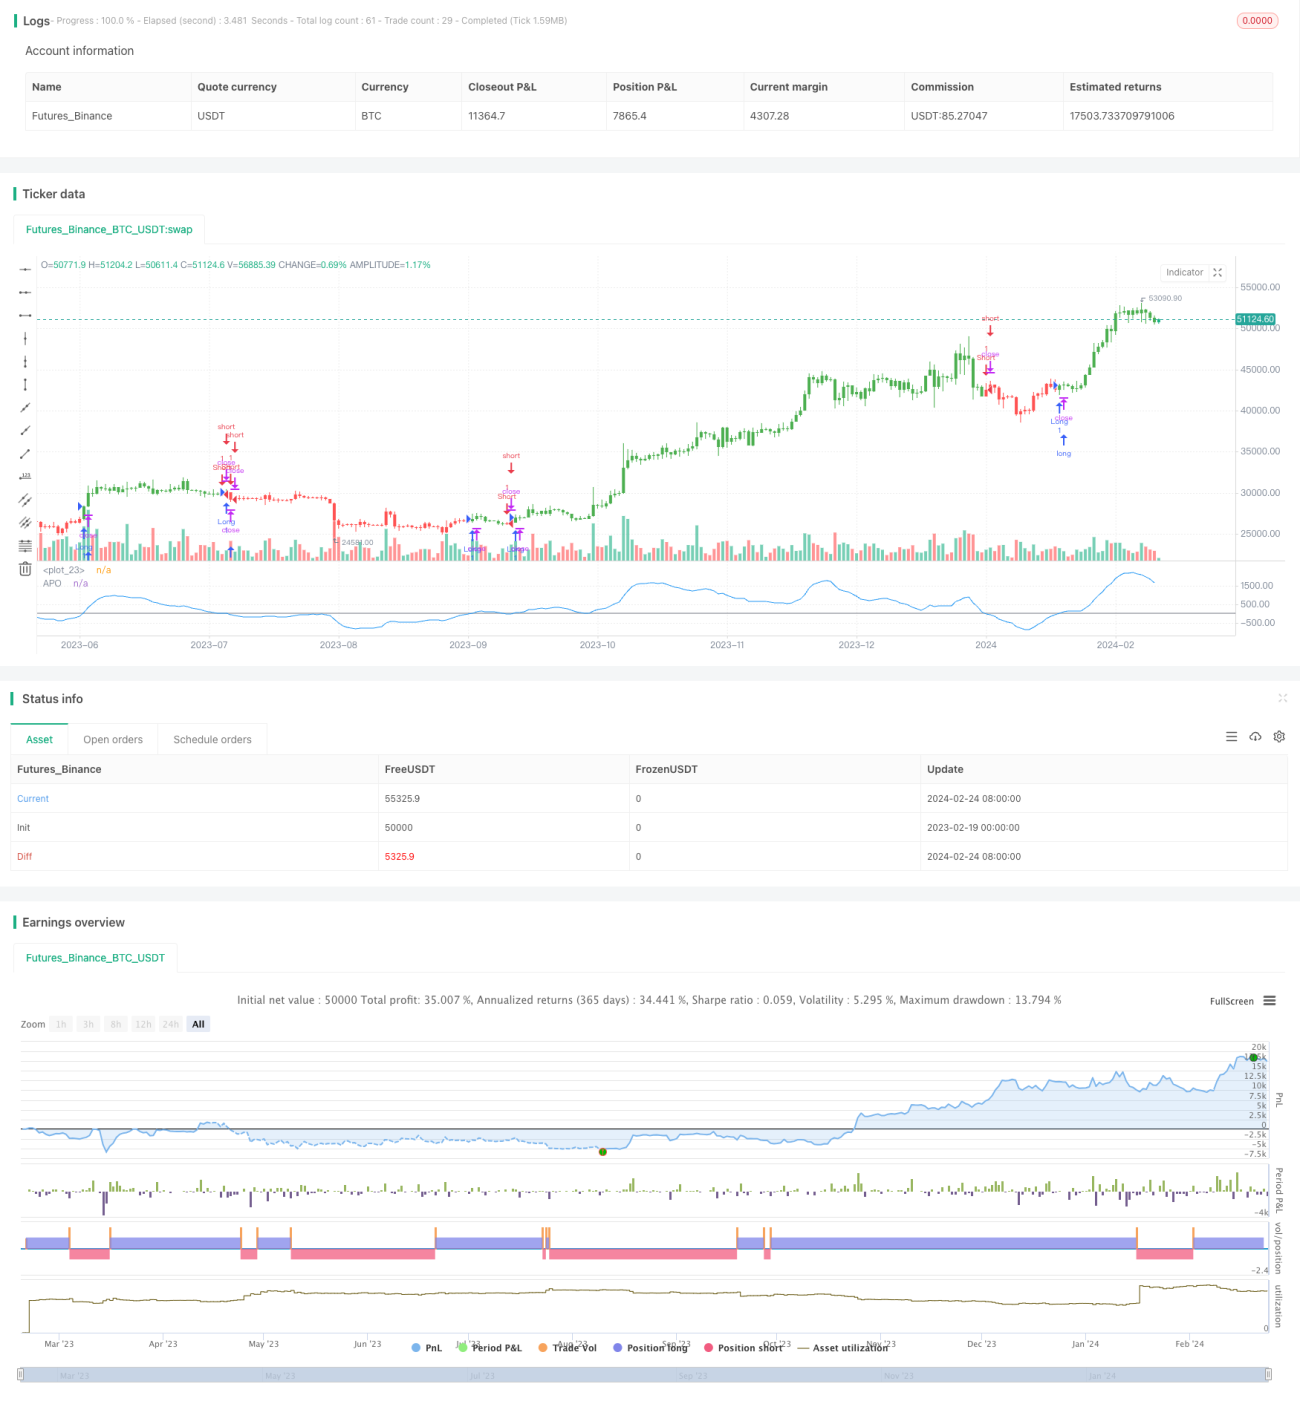
start: 2023-02-19 00:00:00
end: 2024-02-25 00:00:00
period: 1d
basePeriod: 1h
exchanges: [{"eid":"Futures_Binance","currency":"BTC_USDT"}]
*/
//@version=2
////////////////////////////////////////////////////////////
// Copyright by HPotter v1.0 30/05/2017
// The Absolute Price Oscillator displays the difference between two exponential - 1