Average True Range Breakout Strategy with Golden Ratio

Overview
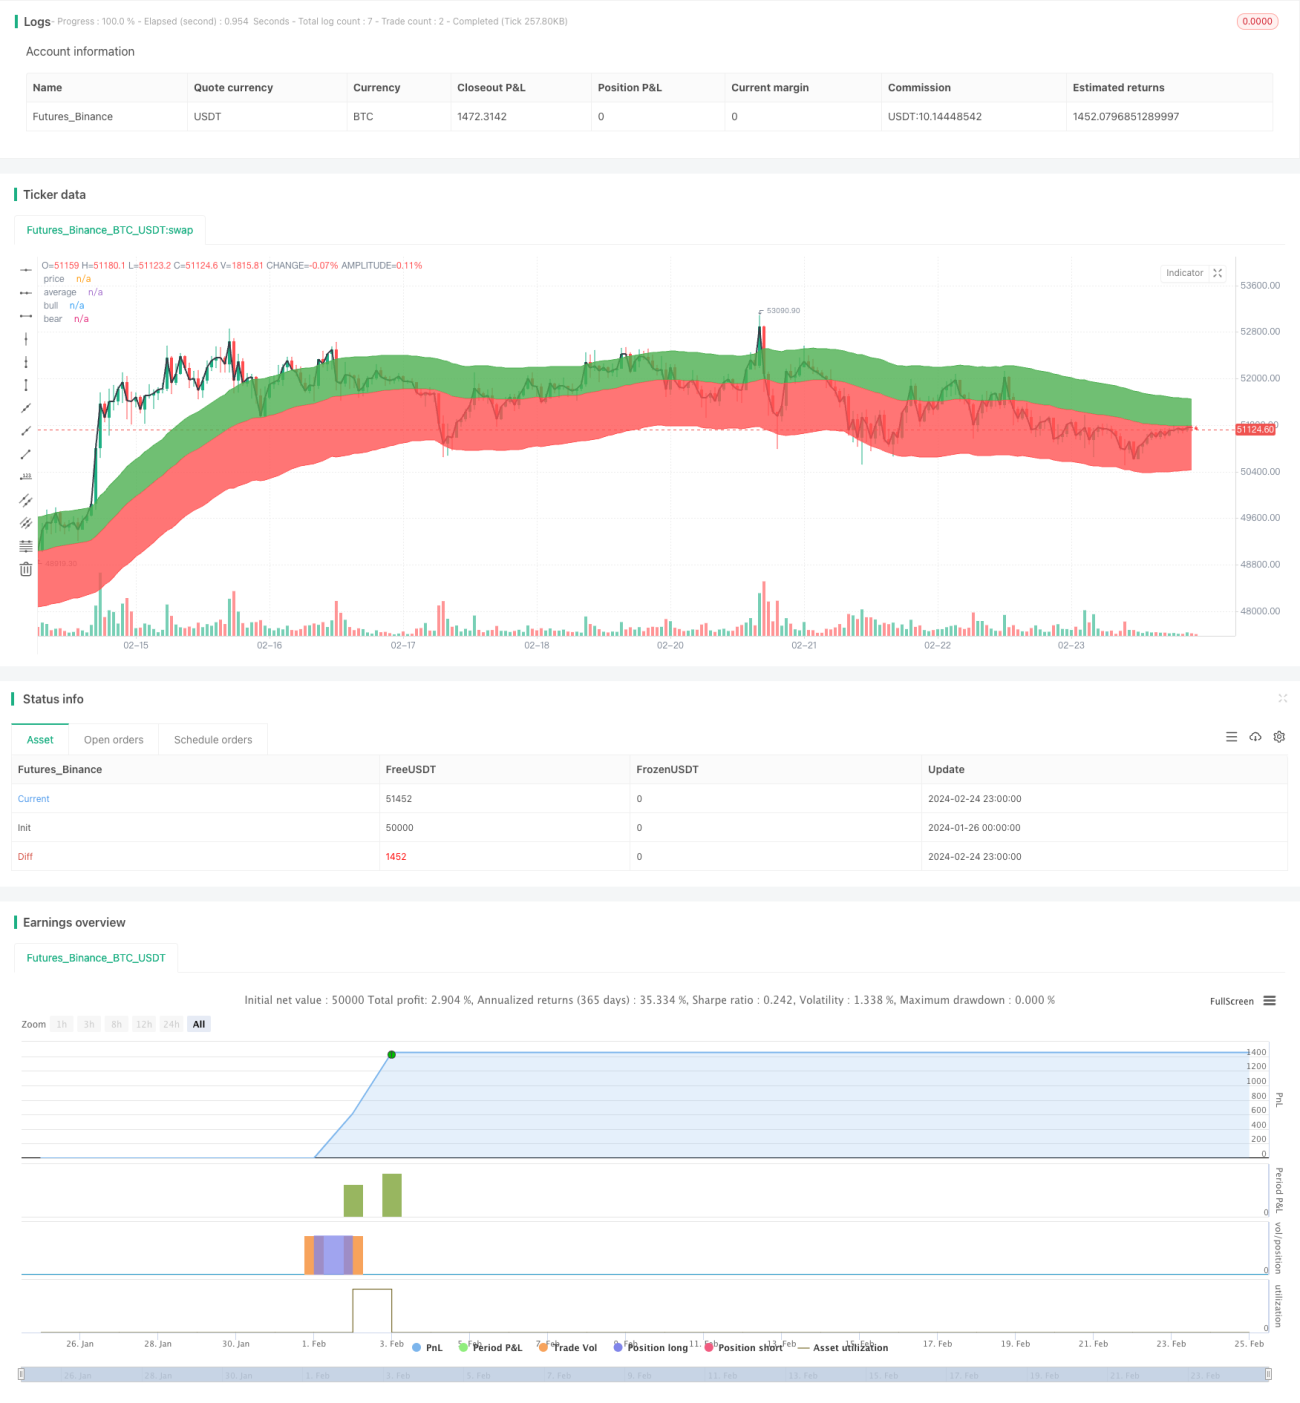
This is a breakout strategy that utilizes the ATR indicator to generate trading signals. The strategy employs a moving average system to produce entry signals and an amplified ATR channel based on the golden ratio to construct long and short positions. It could gain significantly in trends and obtain small but steady profits in range-bound markets.
Principles
The code calculates the ATR over a period of closing prices, amplifies it by 1.618 as the upper band and 2.618 as the lower band. Combined with the EMA, it forms a Bollinger channel breakout system. Go long when price breaks out the lower band upwards and go short when breaking the upper band downwards to follow trends.
Advantages
- The ATR indicator effectively captures market volatility and constructs adaptive trading bands, avoiding overfitting caused by static parameters.
- The amplified ATR bands by the golden ratio expand profit potential without increasing trading frequency.
- The moving average system filters out short-term noises and cooperates with the ATR channel to identify mid-to-long term trends.
Risks
- The ATR indicator may lag during extreme market conditions.
- Improper magnification multiples would lead to excessively high trading frequency.
- Switching signals from long-period moving averages have lags.
Optimization
- The ATR can incorporate the VIX or adjust magnification.
- Employ multiple time frame EMAs to construct adaptive systems.
- Set stop losses to limit maximal loss per trade.
Summary
This strategy integrates moving average filtering, ATR channel tracking and the golden ratio methodology, which can effectively follow mid-to-long term trends with good stability. By tuning parameters, it can be adapted to different products across various frequencies, worthy of exploring for its excellent market adaptivity.
/*backtest
start: 2024-01-01 00:00:00
end: 2024-01-31 23:59:59
period: 1h
basePeriod: 15m
exchanges: [{"eid":"Futures_Binance","currency":"BTC_USDT"}]
*/

//@version=4
strategy("ATR Long Only Strategy lower band buy", overlay=true, default_qty_type=strategy.percent_of_equity, default_qty_value=100)

len = input(52, type=input.integer, minval=1, title="Length")- 1