Dual Moving Average Crossover Strategy

Overview
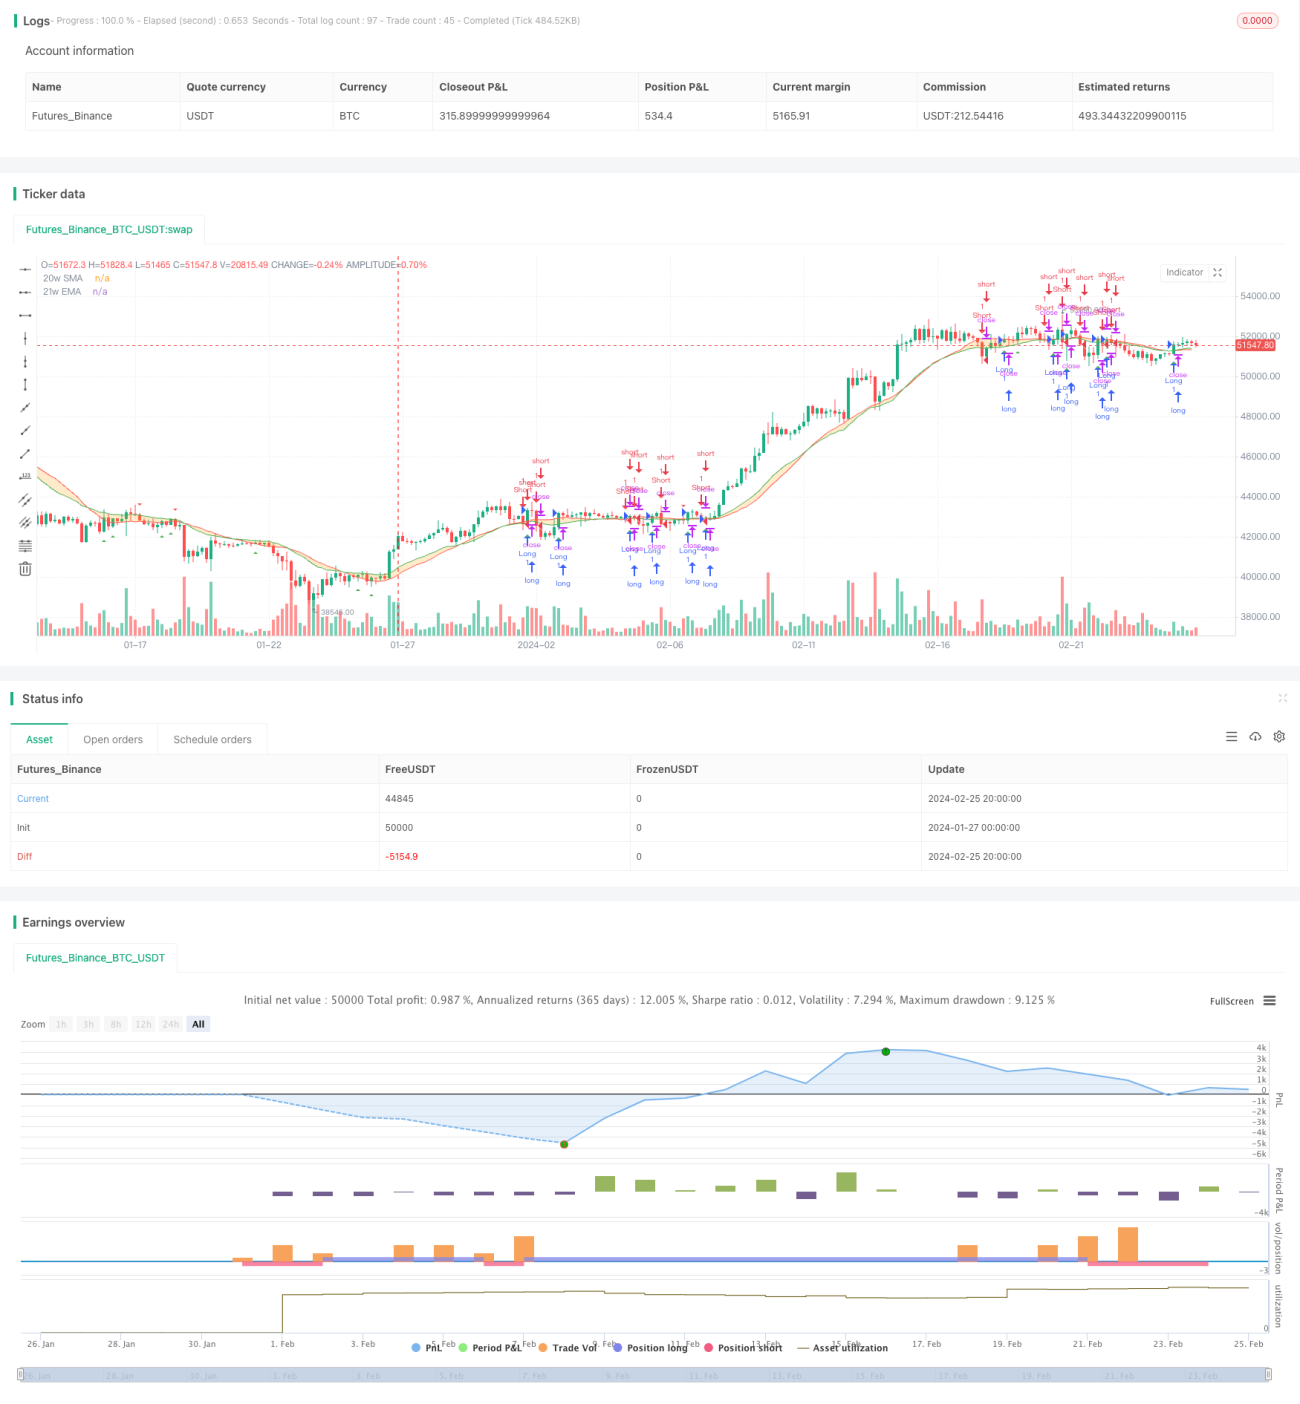
This strategy calculates and plots the 20-period simple moving average (SMA) and 21-period exponential moving average (EMA), fills the color between them to visualize the price fluctuation zone. It generates buy signals when the price crosses above the 20-period SMA and sell signals when the price crosses below the 21-period EMA. The strategy also has trailing stop loss and take profit functions.
Strategy Logic
The core idea of the dual moving average crossover strategy is to use the crossovers between fast and slow moving averages as trading signals. The 20-period SMA responds faster to price changes while the 21-period EMA is slightly lagging but smoother. When the short-term and long-term trends are consistent, i.e. the two moving averages crossover up or down, it indicates the trend is strengthening and the trading decisions made will likely be more profitable.
Specifically, when the closing price crosses above the 20-period SMA, it indicates that both short-term and long-term are in uptrends, so go long. When the closing price crosses below the 21-period EMA, it indicates that both short-term and long-term are in downtrends, so go short. The exit signals are opposite of the entry signals. For example, when price drops below the 20-period SMA, close long positions. When price crosses back above the 21-period EMA, close short positions.
The fill technique is also used to fill color between the two moving averages to form a visual indicator to aid in judging market trends.
Advantages
The dual moving average crossover strategy has the following advantages:
- Simple logic and easy to understand and implement;
- Crossovers of the two moving averages reliably indicate changes in trend direction;
- Visual indicator intuitively displays price fluctuation levels;
- Trailing stop loss and take profit locks in profits and reduces risks;
- High extensibility for various optimizations based on this strategy.
Risks
There are also some risks with this strategy:
- Prone to whipsaws and generating false signals during range-bound periods;
- Improper stop loss and take profit settings may lead to losses or reduced profits;
- Inadequate parameter tuning (e.g. period lengths) may adversely affect strategy performance;
- Automated trading may trigger consecutive losses.
The following measures can be adopted to address the above risks:
- Add filters to avoid entering during choppy periods;
- Optimize stop loss and take profit parameters to balance risk-return;
- Test parameter robustness and select appropriate parameters for the market;
- Manually intervene during exceptional circumstances to prevent enlarged losses.
Enhancement Opportunities
The strategy can be improved in the following aspects:
- Add other technical indicator filters, such as volume and volatility, to avoid false breakouts;
- Dynamically optimize moving average parameters based on machine learning;
- Incorporate sentiment and news analytics to improve decisions;
- Build in adaptive stop loss mechanism to adjust stop loss scale based on market conditions.
Summary
This strategy identifies trend changes using crossovers between fast and slow moving averages, and makes corresponding long and short decisions. It has advantages like simplicity, intuitiveness and ease of implementation, but also bears some risks. The risks can be reduced and performance improved via parameter optimization, adding filters, manual oversight etc. The strategy has great extensibility and is worth in-depth research and application.
- 1