Short-term Trading Strategy Based on Momentum Indicator

Overview
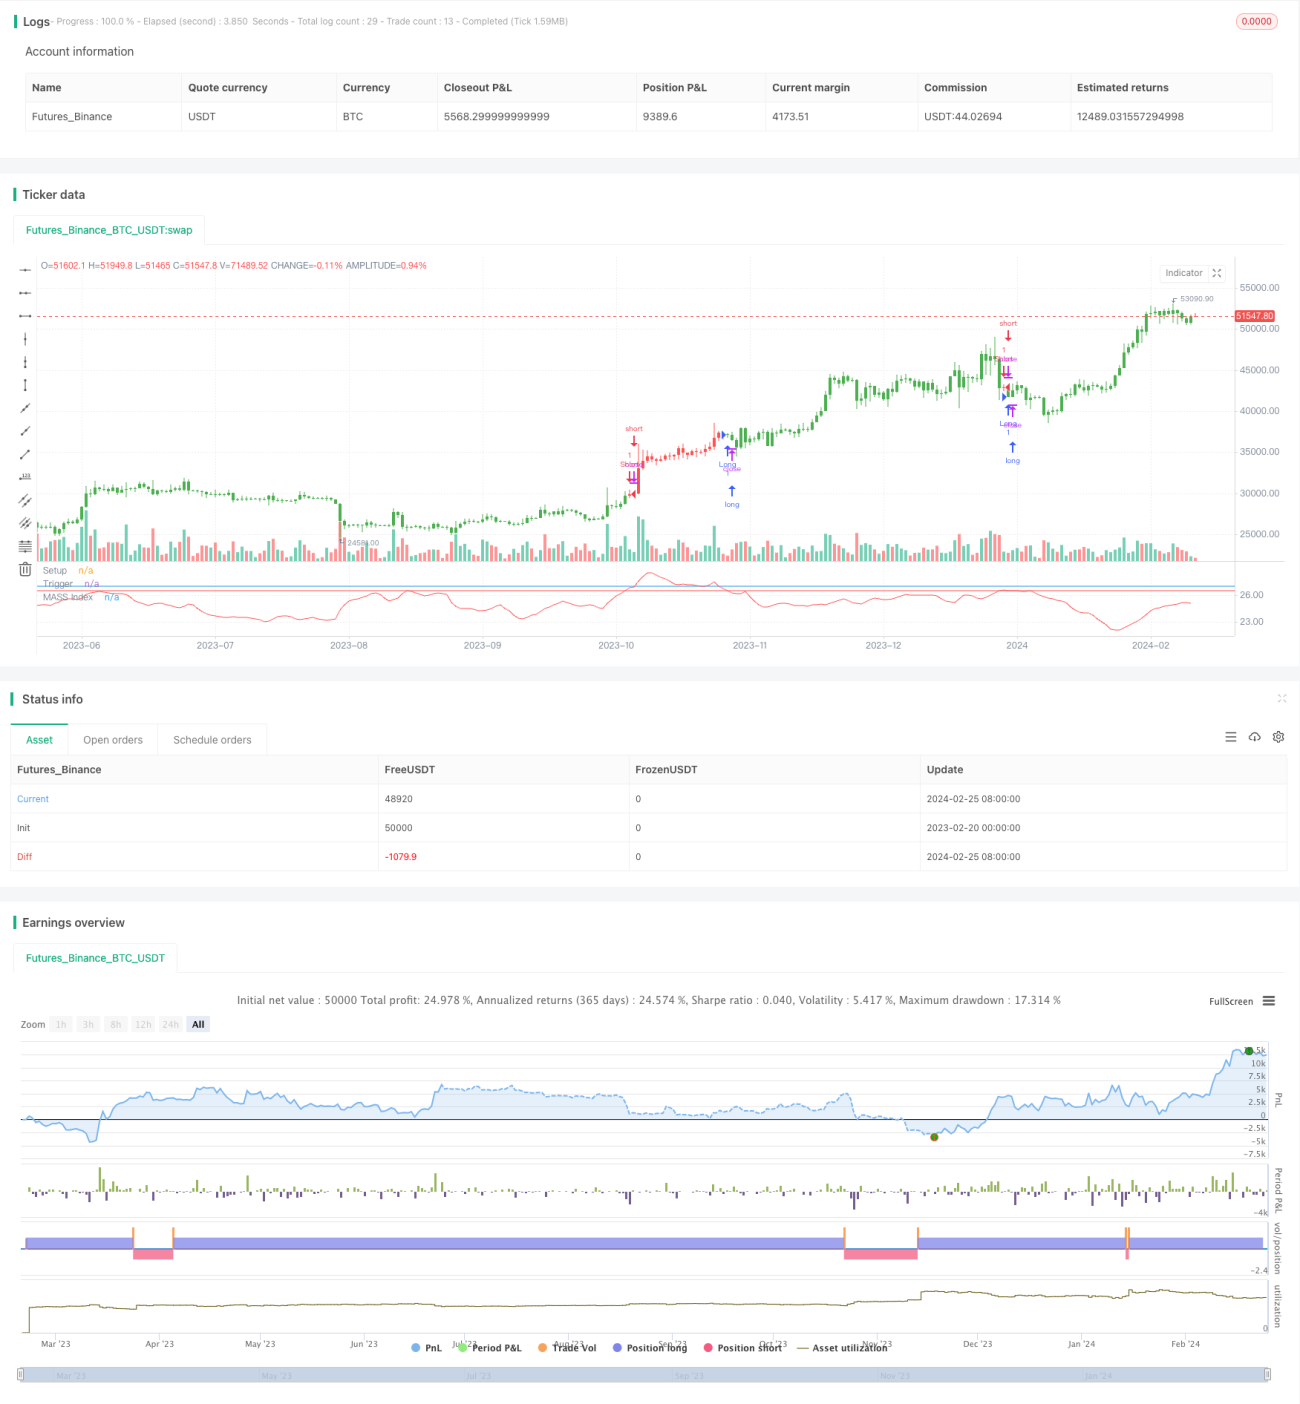
The strategy is named "Short-term Trading Strategy Based on Momentum Indicator". It utilizes the momentum indicator Mass Index to identify turning points in market trends and capture short-term trading opportunities.
Strategy Logic
The strategy uses two exponential moving averages (EMA) with different parameters to smooth the difference between the highest and lowest prices and obtains the Mass Index indicator. It goes short when the Mass Index crosses above a threshold and goes long when crossing below a threshold.
Specifically, it first calculates the difference between the highest and lowest prices xPrice. Then it calculates the 9-period and 25-period EMA of xPrice, named xEMA and xSmoothXAvg respectively. After that, it sums the ratios of these two EMAs to get the Mass Index. When the Mass Index is greater than a threshold, it goes short. When less than a threshold, it goes long.
The strategy identifies trend reversal points by the crossover of Mass Index and thus conducts short-term trading. As market volatility intensifies, Mass Index will rise. As market volatility subsides, Mass Index will fall. Monitoring its breakthrough of certain level can effectively capture short-term trading opportunities.
Advantages
The strategy has the following advantages:
- Using momentum indicator Mass Index can effectively identify fluctuations and turning points in the short term
- Relatively accurate in positioning entry and exit points, avoiding chasing tops and bottoms
- Simple and clear trading strategy and parameters, easy to implement
- Flexible parameter adjustment for different market environments
Risks and Solutions
There are also some risks with this strategy:
- False breakouts may occur, resulting in unnecessary trades. Fine tuning parameters could reduce false signals.
- Long term trends are not considered, which may conflict with the main trend. Combine with trend indicators to avoid counter-trend trades.
- Curve fitting risk. Expand sample periods reasonably to test robustness of parameters.
Optimization Directions
The strategy can be optimized in the following aspects:
- Combine with fundamental analysis to avoid trading highly volatile low quality stocks
- Add stop loss mechanisms to strictly control single loss
- Combine with volatility indicators to reduce position sizing when market volatility rises
- Add conditional orders to optimize entry and exit timing
Conclusion
This strategy designs a simple short-term trading strategy based on the Mass Index indicator, which can effectively identify turning points in the market for precise long and short trades. The trading strategy and parameter settings are simple and intuitive, easy to implement, and adjustable for different market environments, making it highly practical. But risks of overfitting and failure of indicators should also be noticed. Trend analysis and stop loss should be combined to cope with market uncertainty.
/*backtest
start: 2023-02-20 00:00:00
end: 2024-02-26 00:00:00
period: 1d
basePeriod: 1h
exchanges: [{"eid":"Futures_Binance","currency":"BTC_USDT"}]
*/

//@version=2
////////////////////////////////////////////////////////////
//  Copyright by HPotter v1.0 12/09/2017
// The Mass Index was designed to identify trend reversals by measuring - 1