Momentum Reversal Strategy Based on Multiple Timeframes

Overview
This strategy identifies trading opportunities by calculating candlestick body/wick ratios and combining RSI indicators to detect overbought/oversold market conditions. It aims to capture potential reversals in the price momentum over short-to-medium term timeframes.
Strategy Logic
The core logic of this strategy is based on the following:
-
Calculate body/wick percentage of candlesticks: By computing open, close, high and low prices, derive the percentage occupied by candle body and wicks. Wick percentage below 20% indicates a strong candle.
-
Compute candle strength change percentage: Calculate the internal price movement magnitude of each candle to determine candle strength. Larger fluctuations imply stronger momentum and hence indicate stronger candles.
-
Combine with RSI to identify overbought/oversold conditions: Set overbought and oversold threshold lines for RSI. RSI above overbought line signifies overbought state and vice versa for oversold. Strong candles in such states have high probability of reversal.
-
Determine reversal signals: When wick percentage < 20% and candle strength > 2 x average strength, along with previous candle close higher than current candle close, it signals short condition. The opposite indicates long condition.
-
Define stop loss and take profit: Set fixed percentage-based stop loss and take profit levels separately for long and short trades.
Advantage Analysis
The advantages of this strategy include:
-
Effective identification of trend and reversals using candle body/wick proportions. Detects price momentum and turning points well.
-
Higher accuracy of reversal signals by combining candle strength change and RSI. RSI is adjustable providing greater optimization capability.
-
Reasonable stop loss/take profit configuration to capitalize on short-term opportunities while lowering trade risk exposure.
-
Flexible tunability of parameters for optimizing across different products and timeframes. High practical utility.
Risk Analysis
Some risks present in the strategy:
-
Potential false signals during strong trend breakouts. Can be reduced via optimization of candle comparison periods and RSI parameters.
-
Probability of failed reversals can't be eliminated fully. Being long in downtrend and vice versa induces losses. Stop losses should be adjusted accordingly to minimize damage.
-
Performance depends on product and timeframe. Caution warranted when applying to highly volatile products.
Enhancement Opportunities
The strategy can be optimized in the following ways:
-
Fine tune periods considered in identifying overbought/oversold to determine optimal parameter combinations.
-
Optimize overbought/oversold RSI thresholds based on product specifics.
-
Test stop loss/take profit ratios for deriving ideal risk management plan.
-
Categorize products as per volatility for more targeted parameter tuning.
-
Additional filters based on other indicators may improve robustness.
Conclusion
The strategy is highly practical overall for detecting reversals by understanding candlestick information. As a typical short-term trading system, it has sizable optimization capability across products and environments for tracking medium-term trends. However adequate risk control through stop losses is imperative.
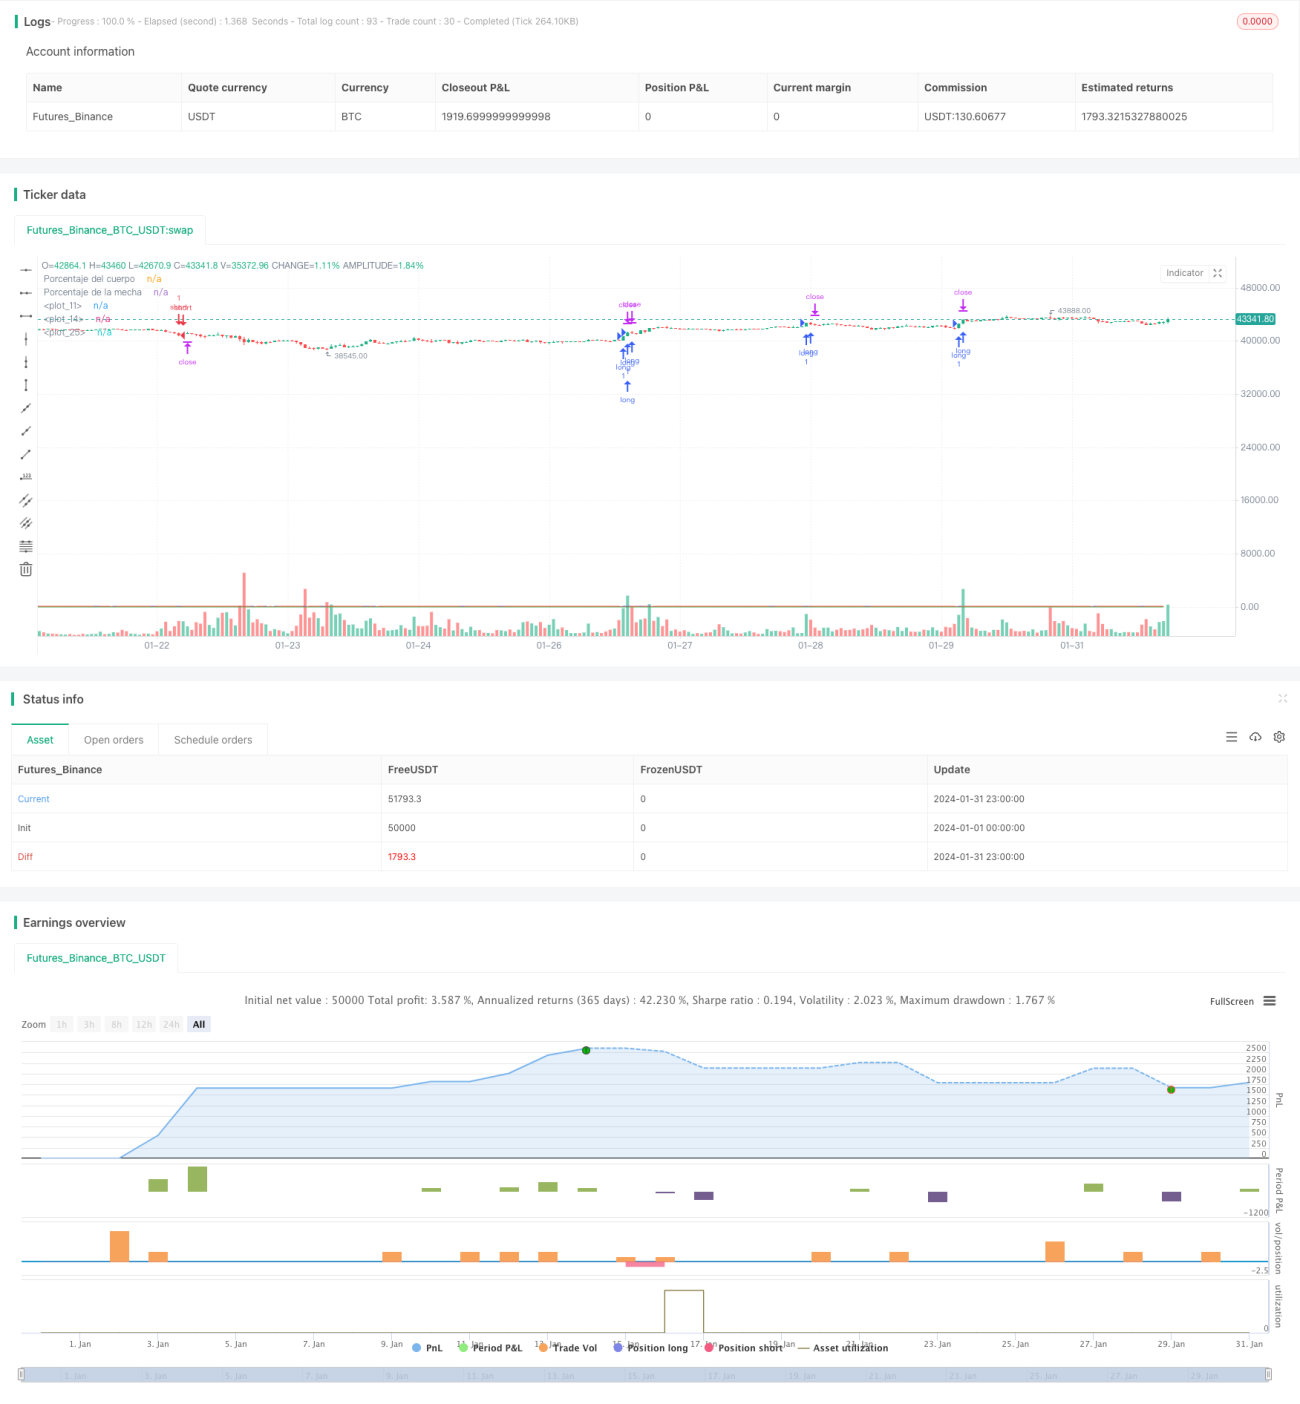
/*backtest
start: 2024-01-01 00:00:00
end: 2024-01-31 23:59:59
period: 1h
basePeriod: 15m
exchanges: [{"eid":"Futures_Binance","currency":"BTC_USDT"}]
*/

//@version=5
strategy("mecha larga study",overlay = true,  max_bars_back = 600)
//Porcentaje Mecha cuerpo
bodyPercent = math.abs(open - close) / (high - low) * 100- 1