Momentum Surfer Strategy Based on Stochastics Momentum Index

Overview
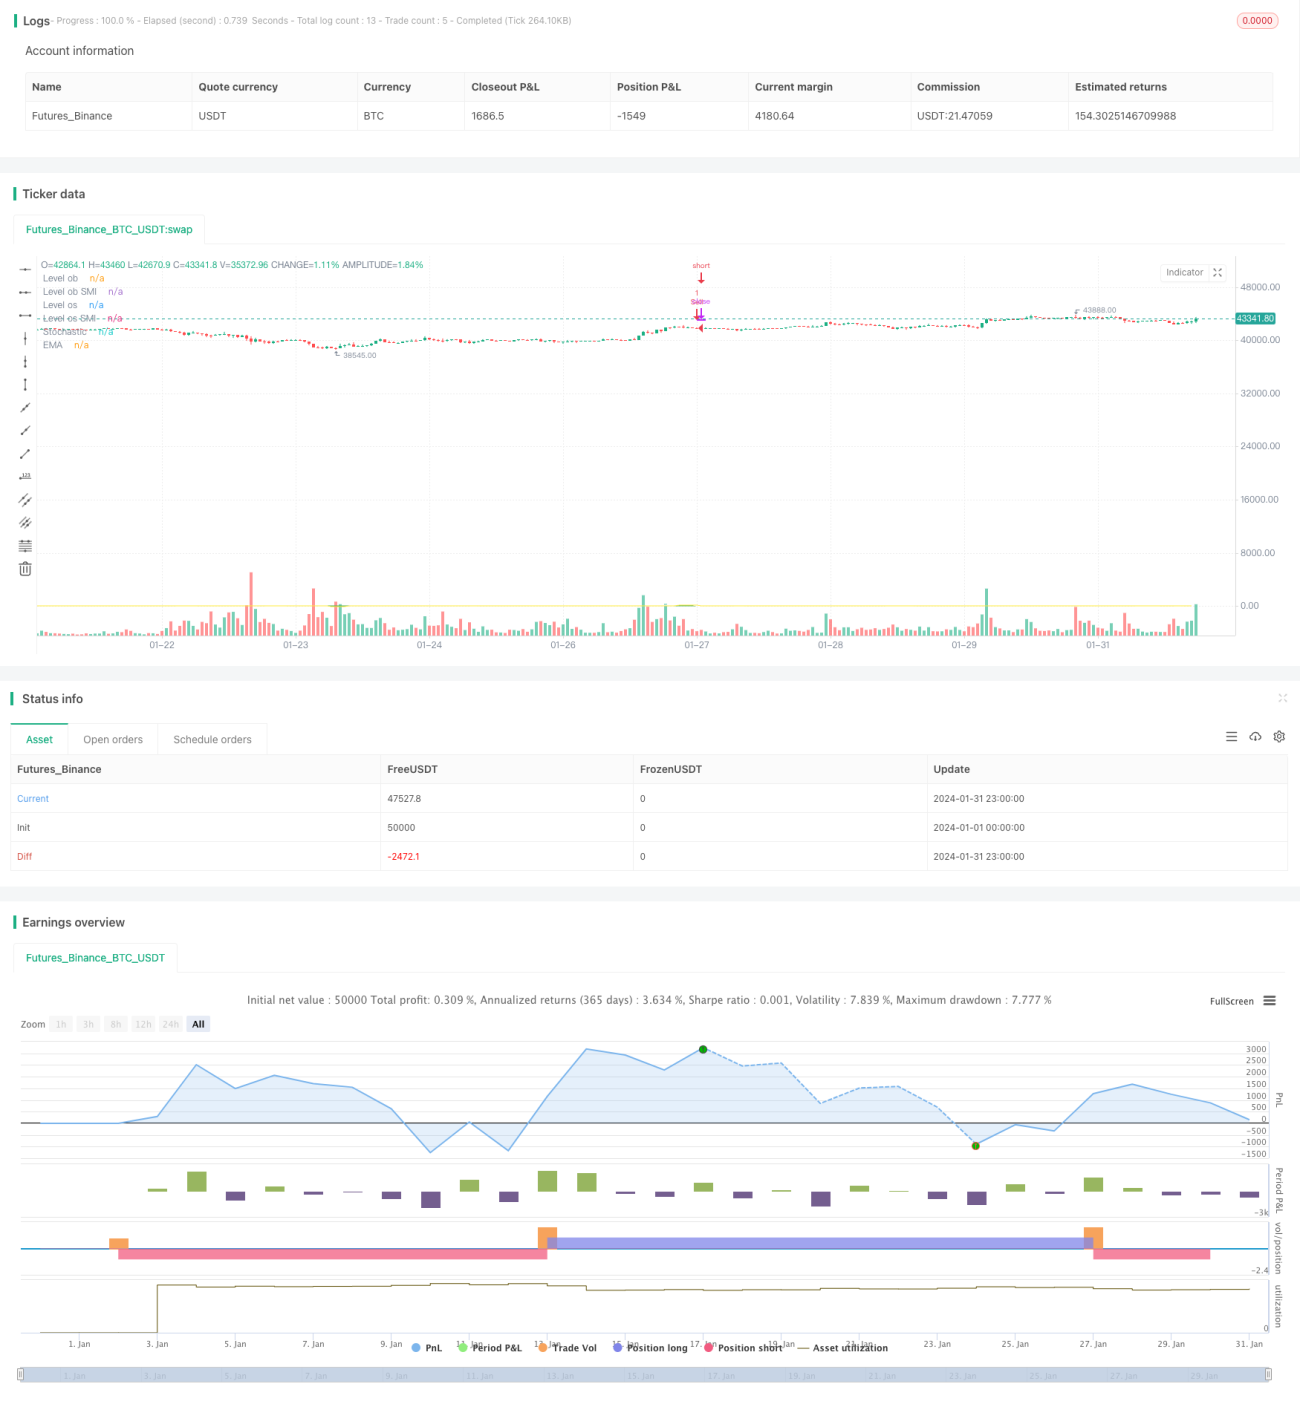
This article introduces a strategy to track stock trends based on the Stochastics Momentum Index (SMI) indicator. The strategy is called "Momentum Surfer Strategy". It identifies overbought and oversold areas with SMI and enters long/short to profit from trend reversals.
Strategy Logic
The SMI indicator is used to identify overbought and oversold zones. Values in the red area indicate the stock is oversold while the green area means overbought conditions. The trading signals are generated from the crossover between SMI and its EMA line.
Specifically, a long signal is triggered when SMI crosses above its EMA and SMI is below -40 oversold level. A short signal is triggered when SMI crosses below its EMA and SMI is above 40 overbought level.
By doing so, the strategy can capture the price reversal and implement buy low sell high. It surfs the uptrend and downtrend of stocks smoothly.
Advantage Analysis
The biggest advantage lies in its ability to follow trends. As it utilizes SMI to determine entry and exit points, the signals align perfectly with price reversals.
Also, SMI itself has the characteristic of smoothing prices. Compared to simple moving averages, it responds more steadily to price changes. The trading signals are more reliable without being easily affected by market noise.
In summary, the strategy successfully leverages the strength of SMI to effectively track stock trends. It generates profit while being suitable for algo trading.
Risk Analysis
The strategy relies heavily on the SMI indicator, thus faces some associated risks.
Firstly, SMI is sensitive to parameter tuning. Incorrect parameters can significantly undermine the signal quality. Extensive testing is required to find the optimum.
Besides, no indicator is immune to false signals, including SMI. Whipsaws can happen during high volatility that causes unnecessary losses. Using SMI together with other indicators helps to confirm signals and reduce errors.
Finally, it does not mitigate systemic market risk. Severe losses are inevitable if the whole market plunges into a bear state. This limitation applies to all technical strategies.
Enhancement
The strategy can be further improved from the following aspects:
-
Incorporate other indicators to form a syndicate system. It helps to increase signal reliability and profitability. Fundamental factors and volatility measures can be added.
-
Utilize machine learning to automatically optimize SMI parameters based on big historical data.
-
Add stop loss mechanisms. Reasonable stop loss enormously reduces single trade loss and avoids risks.
-
Combine quantitative stock screening rules to improve the overall quality of the stock pool. Good stock selection lays the foundation of a robust strategy.
Conclusion
In this article, we introduce the Momentum Surfer strategy which tracks trends with the SMI indicator. Its biggest strength lies in capturing reversals and smoothly following the trends. Some risks like parameter sensitivity and signal quality are present. We suggest a few ways to enhance it. Overall speaking, the strategy is attractive for algo trading and worth real trading verification.
- 1