Momentum Rectangle Channel Dual Moving Average Trading Strategy

Overview
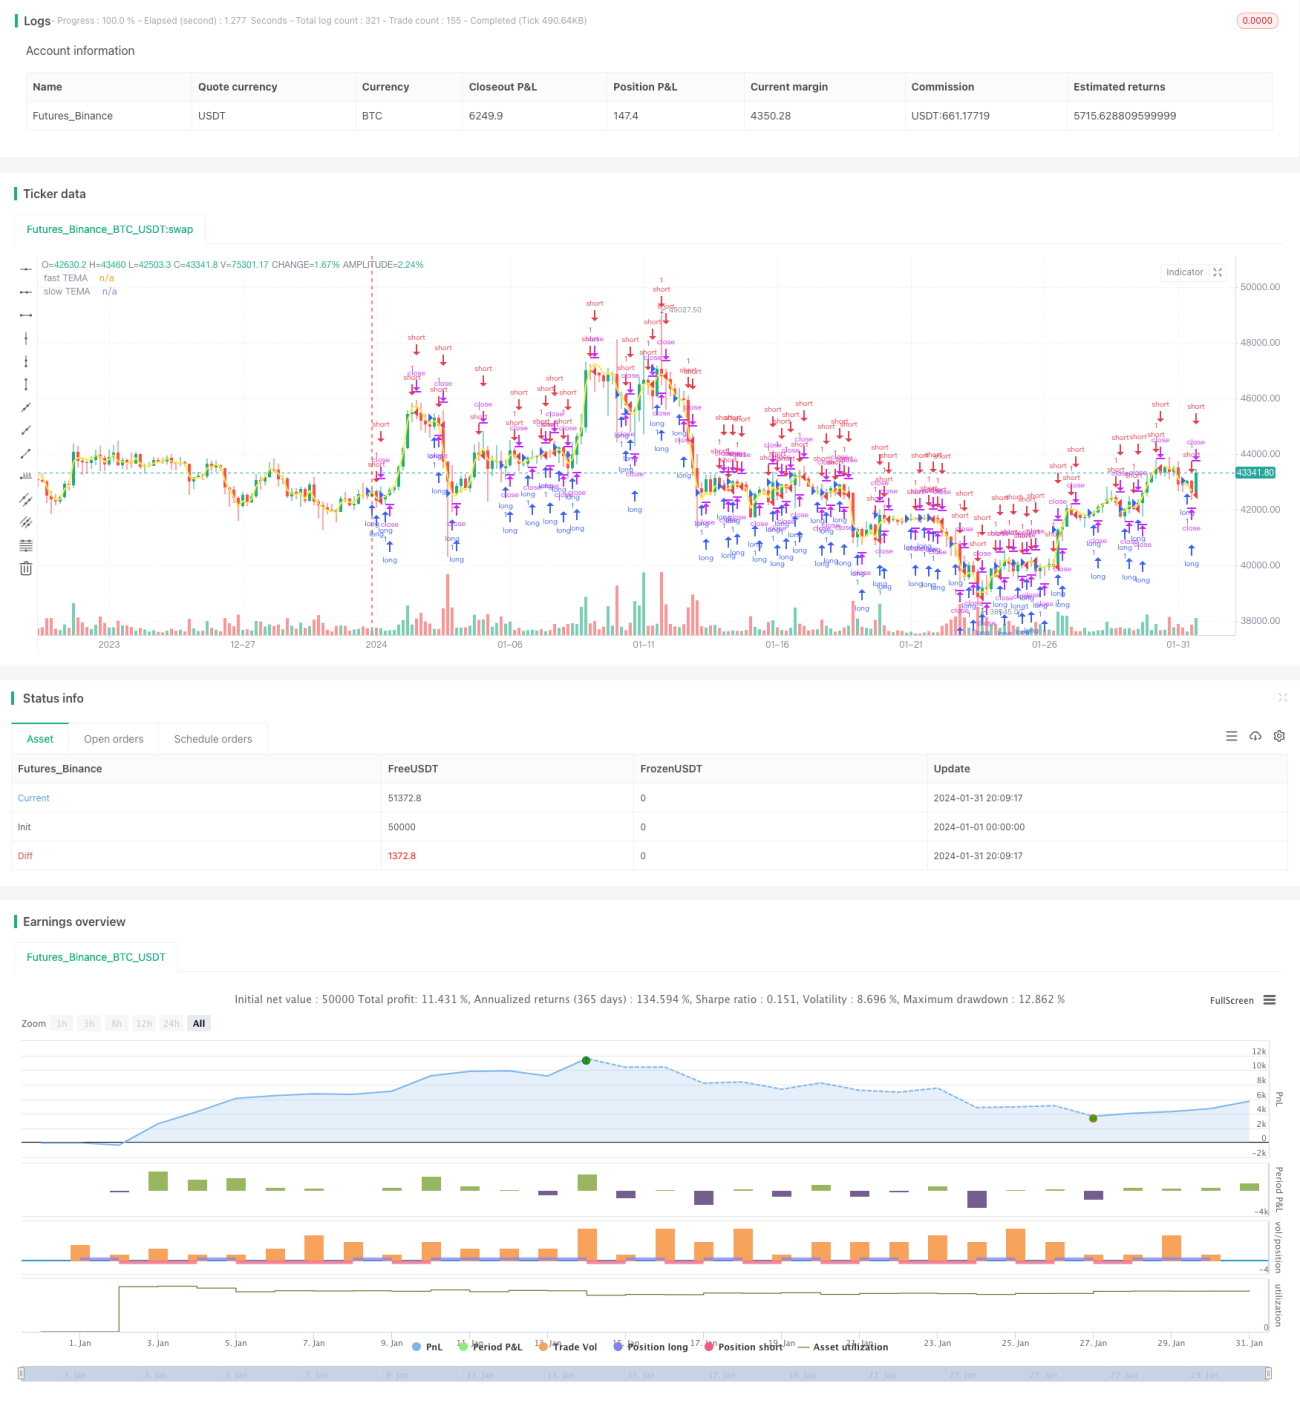
This strategy is based on momentum indicators of Rectangle Channel and Dual Moving Average, which implements a relatively complete stock trading system. The strategy first uses fast EMA and slow EMA to construct dual moving average trading signals. Then, combined with the Rectangle Channel indicator, it further verifies the trading signals to achieve more accurate entry. In addition, the strategy also uses the SAR indicator to assist in judging the trend direction.
Strategy Principle
-
Calculate the moving averages of fast EMA with period 5 days and slow EMA with period 50 days. Fast EMA reflects recent price changes and slow EMA reflects long term trends.
-
Convert EMA to TEMA (Triple Exponential Moving Average), using TEMA's weighted calculation method to improve the sensitivity of the curve and capture price changes faster.
-
When fast TEMA crosses above slow TEMA, a buy signal is generated; when fast TEMA crosses below slow TEMA, a sell signal is generated. The principle of dual moving average crossover is widely used in quantitative trading.
-
Calculate the price channel width to form channel areas. Trading signals are only considered when prices break through the channel. This can filter false signals and verify the real start of a trend.
-
SAR indicator determines the overall trend direction, combined with the dual moving average trading signals, can avoid unnecessary reverse operations.
Advantages of the Strategy
-
The combination of dual moving average crossover and channel breakthrough can effectively identify the beginning of a trend, filter noise, and make buy and sell signals more accurate and reliable.
-
The TEMA curve is more sensitive than the EMA curve and can capture price changes faster.
-
The combination of multiple indicators can form a verification mechanism between indicators to avoid the limitations of a single indicator and make the strategy more comprehensive and robust.
-
The strategy parameters are flexible, EMA cycles, channel widths, etc. can be adjusted and optimized according to market conditions for strong adaptability.
Risks of the Strategy
-
There is a probability of violent fluctuations in stock prices in the short term, which can easily trigger a stop loss.
-
Sudden events may cause price gaps that cannot be traded at expected prices.
-
Dual moving average crossovers cannot completely avoid false signals, there is still a certain misjudgment rate.
-
Improper parameter settings can lead to excessively frequent or lagging trading signals.
Optimization Directions
-
More indicators such as KD and MACD can be combined for verification to make the strategy more comprehensive and reliable.
-
Dynamic cycles can be set to adjust the parameters of EMA and Channel according to the degree of market volatility, making the strategy more flexible.
-
Machine learning models can be established to train a large amount of historical data to automatically optimize parameter settings and reduce manual intervention.
-
Text analysis and news sentiment judgment can be combined to avoid unnecessary trading when major news is released.
Summary
This strategy forms trading signals through fast-slow TEMA moving average crossover, and then verifies them with price channel and SAR indicator, which can effectively identify the beginning of stock price trends and make buy and sell operations at reasonable positions. The combination of multiple indicators to verify each other can improve the reliability of signals and is a relatively robust and efficient stock trading strategy. By continuously optimizing parameter settings, adding new verification indicators, etc., the effect of the strategy can be further improved.
- 1