MACD Crossover Strategy with RSI Confirmation

Overview
This strategy combines the Moving Average Convergence Divergence (MACD) indicator with the Relative Strength Index (RSI) indicator. It checks if RSI is above 50 when MACD golden cross happens to confirm buy signals, and checks if RSI is below 50 when MACD death cross happens to confirm sell signals. This helps filter out some false signals and improves the stability of the strategy.
Strategy Logic
The core of the strategy lies in the MACD indicator crossovers and the RSI indicator judgments of overbought/oversold levels.
The MACD indicator consists of the MACD line, signal line and histogram. When the MACD line crosses above the signal line, a buy signal known as the golden cross is generated. When the MACD line crosses below the signal line, a sell signal known as the death cross is generated. The golden cross indicates the uptrend is strengthening and long positions can be considered. The death cross indicates the downtrend is strengthening and short positions can be considered.
The RSI indicator judges overbought/oversold levels. If RSI is above 50, it signals that the market is in uptrend and buy signals are more reliable. If RSI is below 50, it signals that the market is in downtrend and sell signals are more reliable.
Therefore, when MACD golden cross happens and RSI is above 50, it enhances the reliability of the buy signal triggered by the golden cross. When MACD death cross happens and RSI is below 50, it enhances the reliability of the sell signal triggered by the death cross.
The trading rules for this strategy are:
-
Go long when MACD golden cross happens and RSI is above 50.
-
Go short when MACD death cross happens and RSI is below 50.
-
Exit after a fixed number of bars since the MACD crossover.
Advantage Analysis
The strategy combines the strengths of both the MACD and RSI indicators to effectively filter out false signals and avoid bad trades. The main advantages are:
-
MACD is the core indicator here for determining market trend and crossover signals. It has advantages like good trend following, clear indicator meanings, and widespread usage.
-
RSI helps judge overbought/oversold levels and filter unreliable signals. It is easy to use with simple parameter tuning.
-
The two indicators complement each other when used together. MACD determines trend direction and crossover signals, while RSI assists in filtering the signals. This combination is clear and easy to implement.
-
The fixed exit mechanism can lock in profits and manage risks. It prevents excessive losses due to overstaying in trades.
Risk Analysis
Despite the many advantages, there are still some potential risks to consider for this strategy:
-
MACD may generate incorrect or lagging signals, i.e. the crossover signals can lag, causing missed best entry points during fast price changes.
-
RSI may also generate false signals. It may whipsaw above and below the 50 line during market consolidations, generating frequent but unreliable trade signals.
-
The fixed exit mechanism fails to fully capture trending moves. Exiting too early during strong trends means missing out on profit opportunities.
-
The strategy is more suitable for short-term trading. Its efficacy may diminish in medium-to-long term trading which requires considering more complex factors.
To mitigate the above risks, methods like parameter tuning, optimizing indicator combos, using stops, combining other factors etc. can be employed.
Optimization Directions
The following aspects of the strategy can be optimized:
-
Optimize MACD parameters by testing different fast/slow line differences to find the best fit.
-
Optimize RSI parameters by testing combinations of short/long-term RSI.
-
Add stop loss mechanisms to limit losses in a timely manner.
-
Incorporate other factors like volume and volatility to further confirm signal reliability.
-
Dynamically adjust exit rules based on market conditions rather than fixed number of bars. This can help lock in more profits during strong trends.
-
Employ machine learning techniques to continually monitor and improve strategy performance over time.
Conclusion
The MACD and RSI crossover strategy combines the strengths of two widely used technical indicators. It can effectively determine market trends, identify reversal signals, while avoiding lots of false signals through the RSI filter. Overall, this simple and easy-to-use strategy works well for short-term mean reversion style trading. Of course, no strategy can be perfect. We still need to continually optimize the combinations and management mechanisms, and incorporate more factors to deal with the ever-changing market environments.
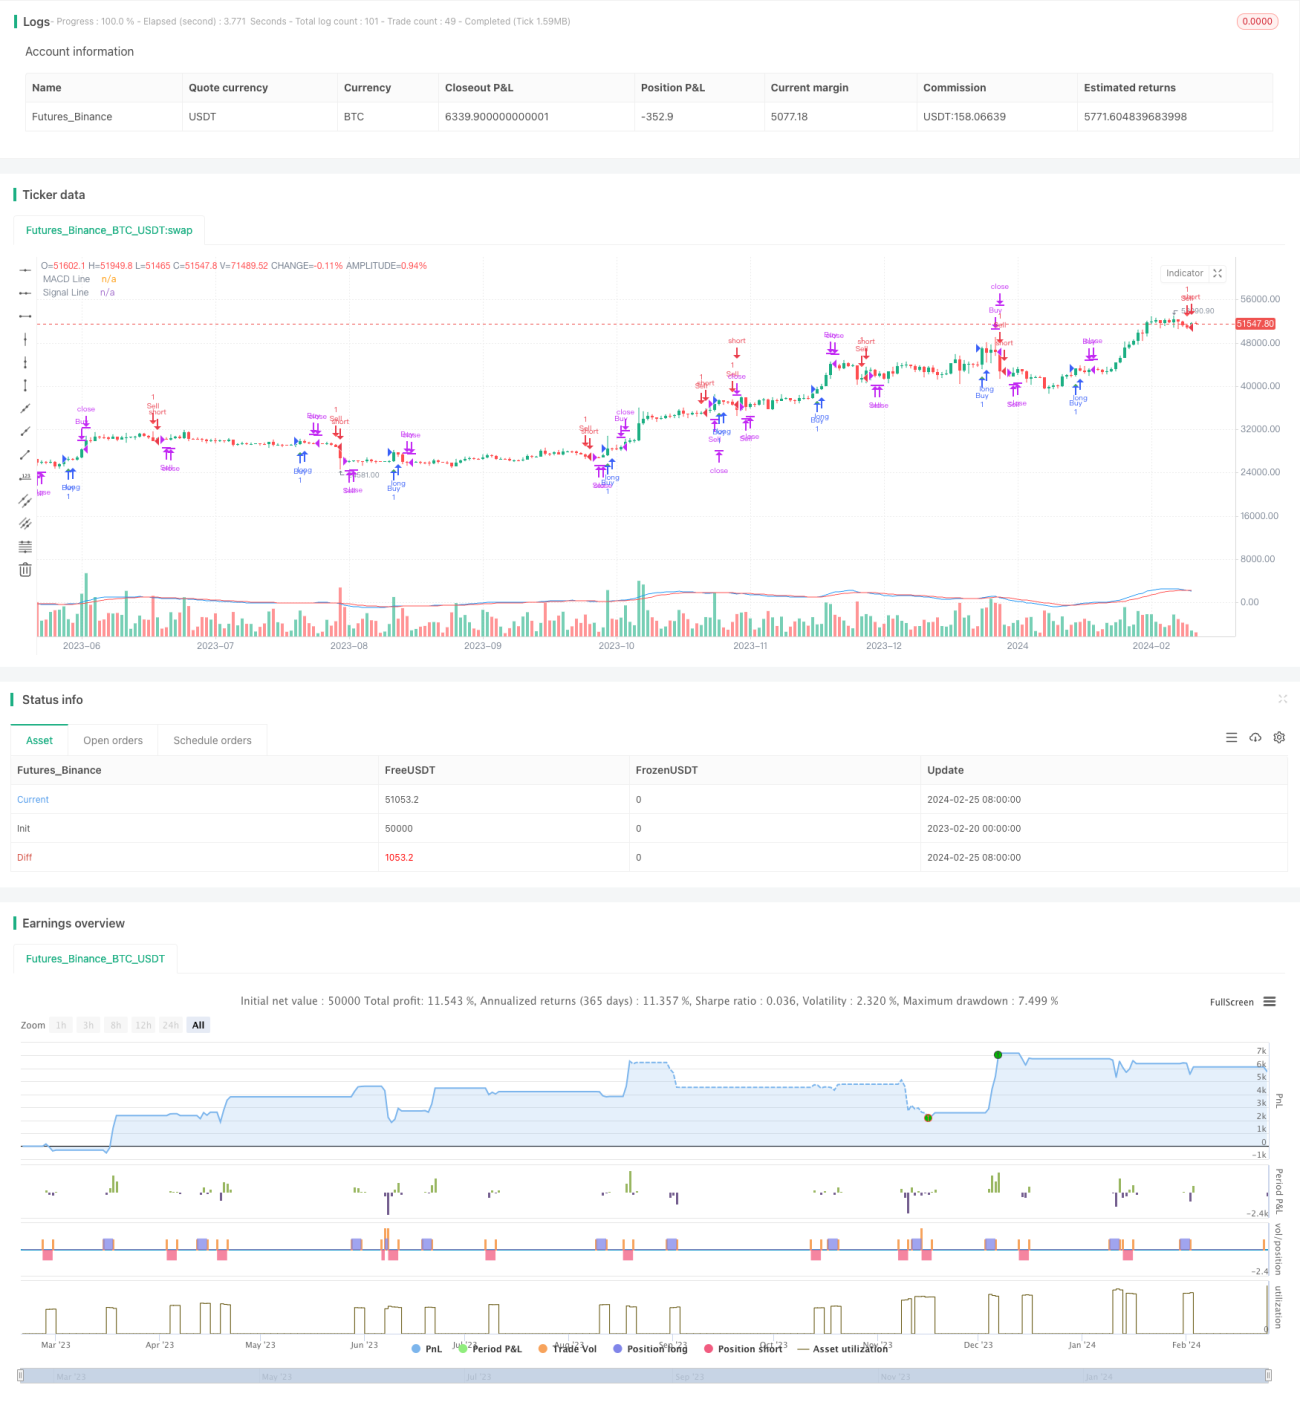
/*backtest
start: 2023-02-20 00:00:00
end: 2024-02-26 00:00:00
period: 1d
basePeriod: 1h
exchanges: [{"eid":"Futures_Binance","currency":"BTC_USDT"}]
*/

// This Pine Script™ code is subject to the terms of the Mozilla Public License 2.0 at https://mozilla.org/MPL/2.0/
// © ayamtech1
//@version=5
strategy("MACD Crossover Strategy with RSI Confirmation", overlay=true)- 1