Combo Quantitative Trend Tracking Strategy

Overview
The core idea of this strategy is to combine the 123 reversal strategy and the rainbow oscillator indicator to achieve double trend tracking and improve the winning rate of the strategy. By tracking short-term and medium-term price trends dynamically, this strategy adjusts positions to achieve excess returns over benchmarks.
Principles
The strategy consists of two parts:
-
123 Reversal Strategy: Go long if the closing price declines for the previous two days and rises today, and the 9-day Slow K line is below 50; Go short if the closing price rises for the previous two days and falls today, and the 9-day Fast K line is above 50.
-
Rainbow Oscillator Indicator: This indicator reflects the degree of deviation of prices relative to moving averages. When the indicator is higher than 80, it indicates that the market tends to be unstable. When the indicator is lower than 20, it indicates that the market tends to reverse.
This strategy opens positions when both long and short signals appear, otherwise flattens positions.
Advantage Analysis
The advantages of this strategy are:
- Double filter improves signal quality and reduces misjudgment.
- Dynamic position adjustment reduces losses in one-way markets.
- Integrates short-term and medium-term indicators to improve stability.
Risk Analysis
The risks of this strategy include:
- Improper parameter optimization may lead to overfitting.
- Double opening increases trading costs.
- Stop loss point is vulnerable when price fluctuates violently.
These risks can be mitigated by adjusting parameters, optimizing position management, and setting stop loss reasonably.
Optimization Directions
This strategy can be optimized in the following aspects:
- Optimize parameters to find the best parameter combination.
- Add position management module to adjust positions dynamically based on volatility and drawdown.
- Increase stop loss module and set reasonable moving stop loss.
- Increase machine learning algorithms to assist in judging inflection points.
Conclusion
This strategy integrates the 123 reversal strategy and the rainbow oscillator indicator to achieve double trend tracking. While maintaining high stability, it has potential for excess returns. Further optimization can be done to improve the profitability of the strategy.
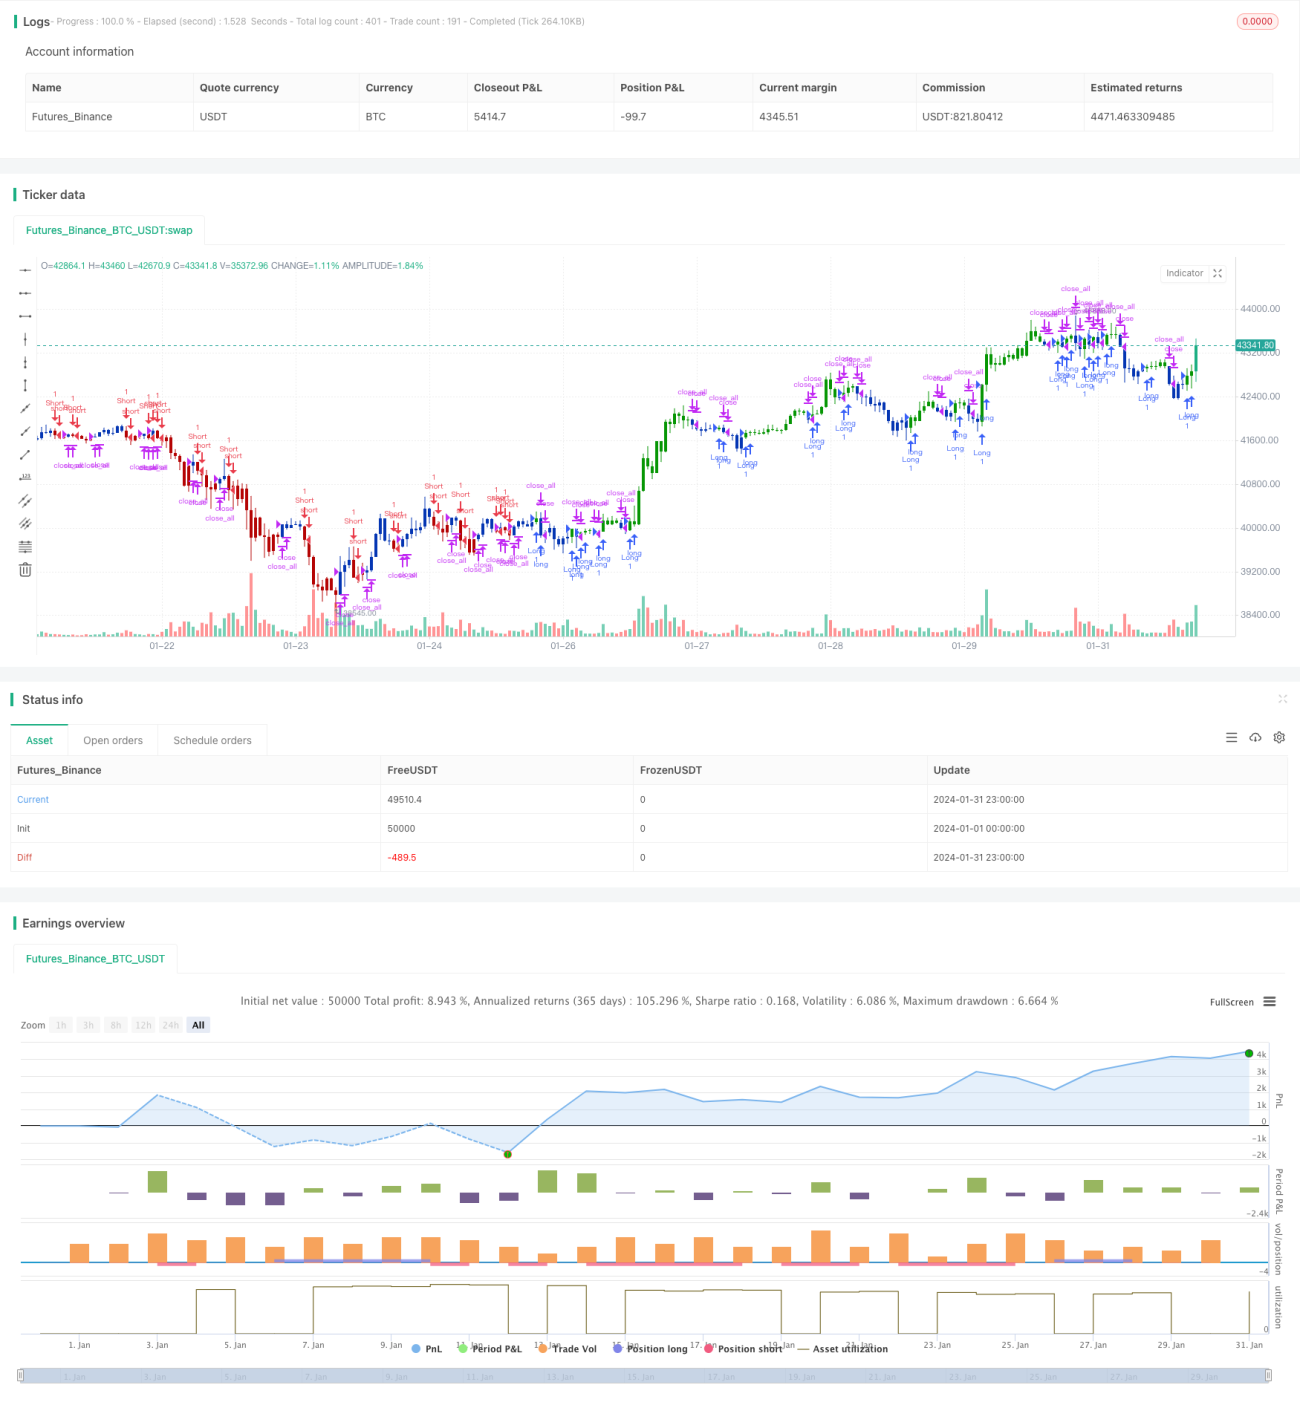
/*backtest
start: 2024-01-01 00:00:00
end: 2024-01-31 23:59:59
period: 1h
basePeriod: 15m
exchanges: [{"eid":"Futures_Binance","currency":"BTC_USDT"}]
*/

//@version=4
////////////////////////////////////////////////////////////
//  Copyright by HPotter v1.0 25/05/2021
// This is combo strategies for get a cumulative signal. - 1