Dual Moving Average Crossover Strategy

Overview
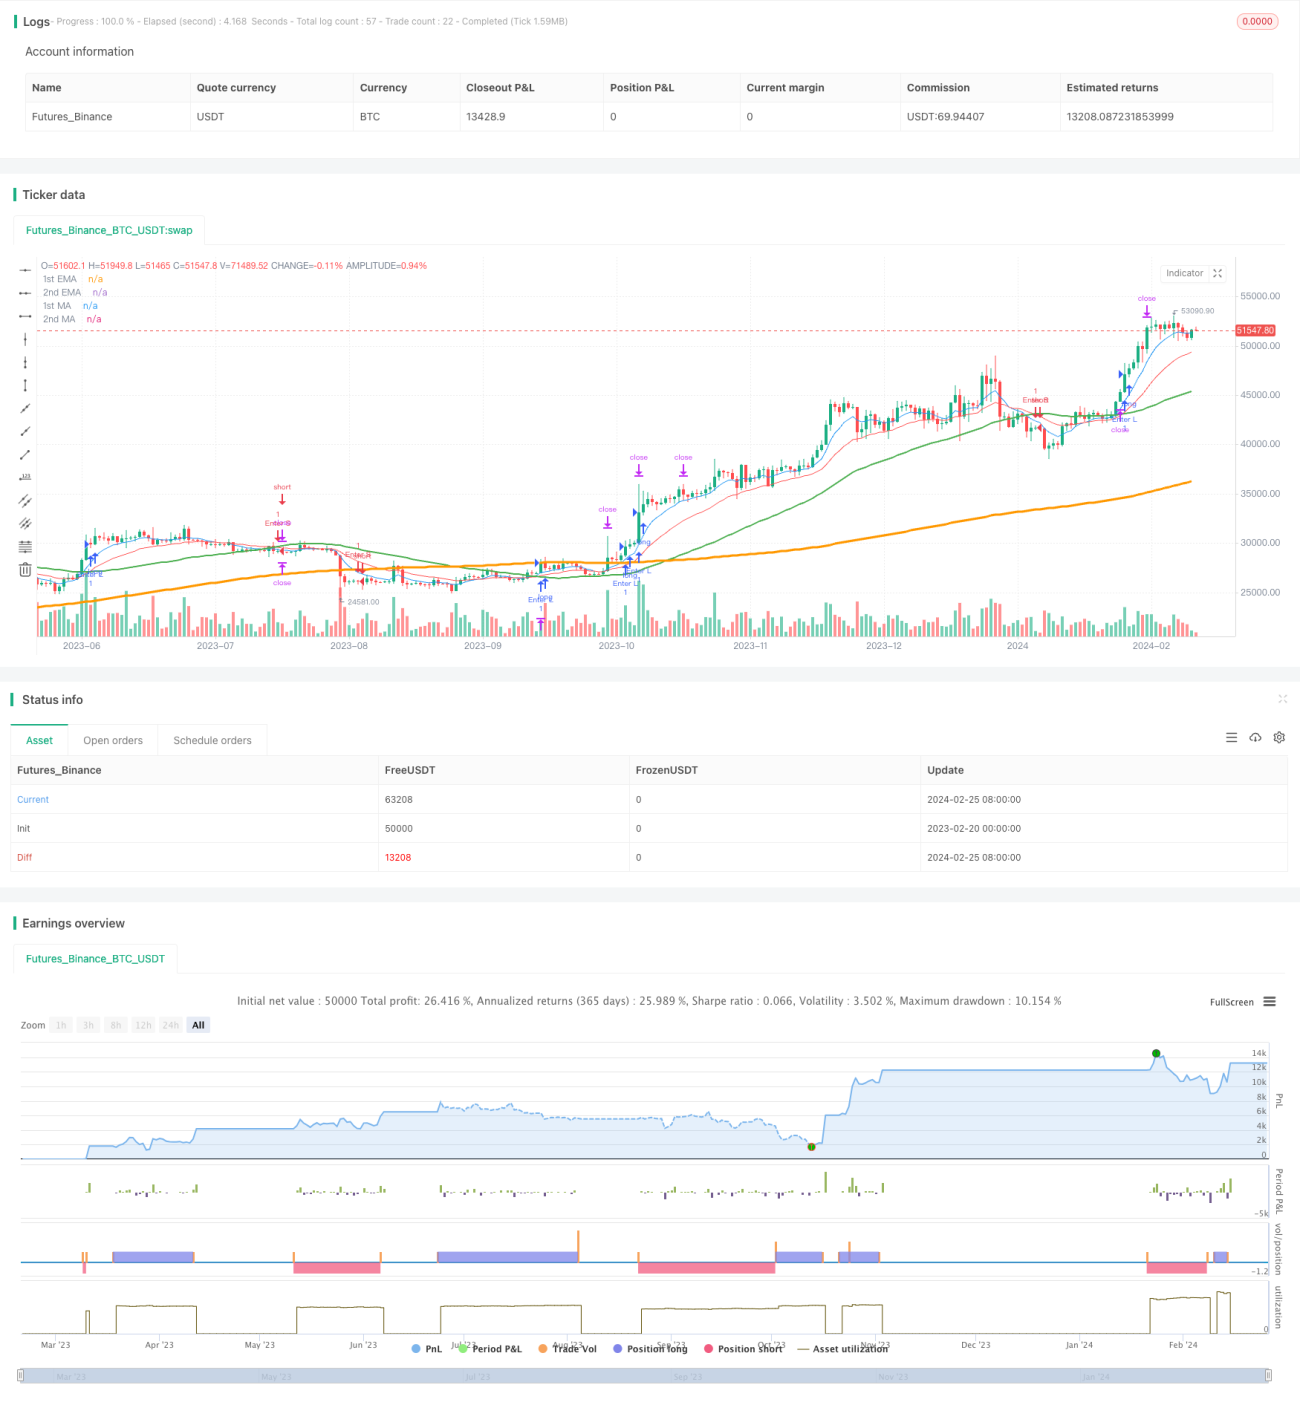
This strategy is a typical moving average crossover strategy that uses two sets of moving averages, one fast and one slow. When the fast moving average crosses over the slow moving average, a buy signal is generated. When the fast crosses below the slow, a sell signal is generated. The strategy uses both EMA and SMA for the moving averages, with EMAs as the fast lines and SMAs as the slow lines. Using multiple moving averages can help filter out false signals and improve reliability.
Strategy Logic
The core logic relies on crossovers between fast and slow moving average lines to determine entries and exits.
Specifically, two sets of fast and slow moving averages are calculated:
- 1st Fast EMA, length 8 days
- 2nd Fast EMA, length 21 days
- 1st Slow SMA, length 50 days
- 2nd Slow SMA, length 200 days
Crossovers are then checked between the fast EMAs and slow SMAs:
- If 8-day EMA crosses over 50-day SMA, golden cross signal
- If 8-day EMA crosses below 50-day SMA, death cross signal
To filter false signals, a second EMA/SMA crossover is required for confirmation:
- Only when 21-day EMA also crosses over/under 50-day SMA, trading signal is triggered
By requiring two fast/slow MA crossovers, many false signals can be filtered out and reliability improved.
When buy signal triggers, go long. When sell signal triggers, go short.
The strategy also sets profit taking and stop loss based on input percentage from entry price once in a position.
Advantage Analysis
The advantages of this strategy include:
- Dual MA design filters false signals and improves accuracy
- Combination of EMA and SMA utilizes EMA's sensitivity and SMA's smoothness
- Take profit and stop loss lock in profits and control risks
- Simple logic easy to understand and modify
- Customizable parameters suit different market environments
Risk Analysis
Risks of the strategy:
- MA strats tend to produce lots of small wins/losses in choppy markets
- Can face large losses in strong trending markets
- Poor parameter tuning also leads to underperformance
To control risks:
- Adjust parameters for different market conditions
- Optimize based on backtests to fit target market
- Use stop loss to limit loss size
Improvement Directions
The strategy can be further optimized by:
- Testing more fast/slow MA combinations to find best
- Using machine learning or genetic algos to auto optimize
- Adding trend filter to avoid counter-trend trades
- Adding trailing stop loss to lock in profits
- Incorporating volume or volatility filters to confirm signals
- Combining with other strats/products to utilize low correlation
Conclusion
In summary, the dual MA crossover strategy generates signals with fast/slow MA crosses, sets take profit and stop loss to control risks, and is simple, intuitive and easy to implement. The parameters can be tuned and combined with other indicators for better performance. It has great utility in quantitative trading.
- 1