Mayan Treasure Hunting Guide

Overview
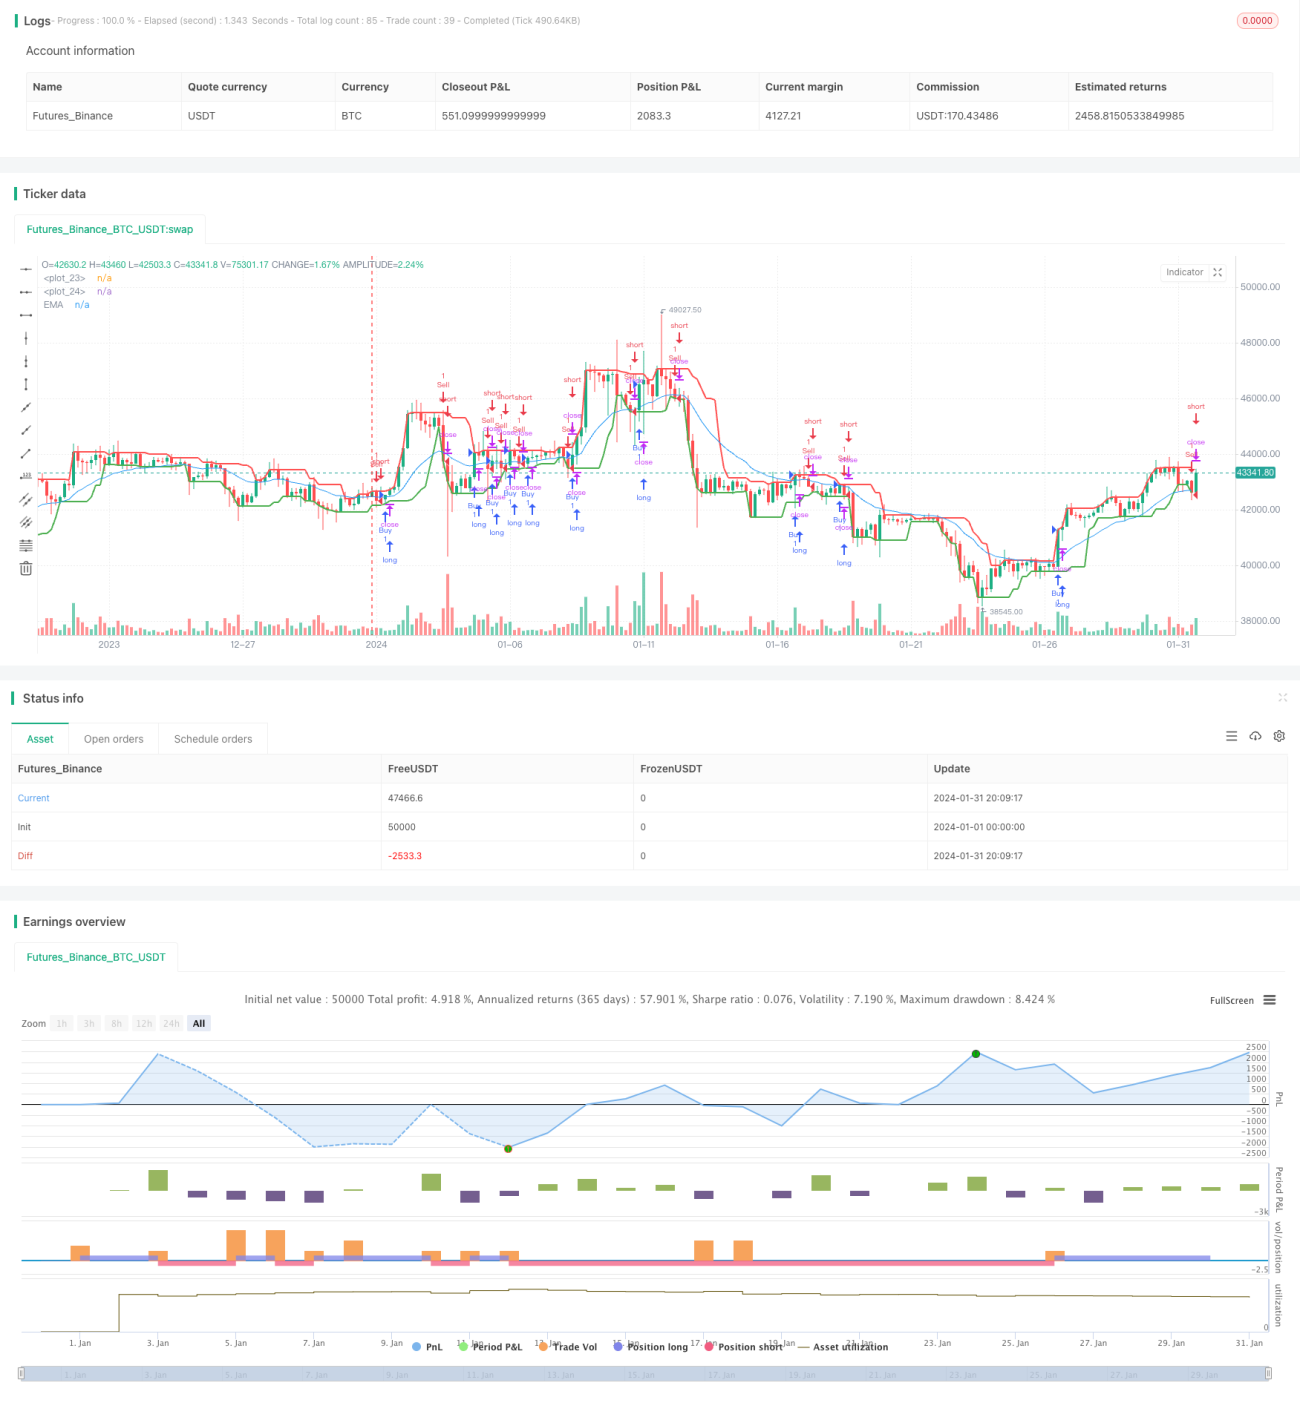
The Mayan Treasure Hunting Guide is a simple stock trading strategy based on the EMA indicator. The strategy combines the EMA line indicator and price highs and lows to set buy and sell conditions for automated trading.
Strategy Principles
The core of this strategy relies on the EMA indicator. EMA stands for Exponential Moving Average, which is a commonly used trend judgment indicator. The EMA line can smooth price fluctuations and determine the direction of the price trend.
When stock prices rise, they will stand above the EMA line, which is considered a buy signal. When prices fall, they will stand below the EMA line as a sell signal. This strategy sets a 20-day EMA line as the decision benchmark.
In addition, the strategy also combines the highest and lowest prices of the day to assist in judgment. At the moment of the EMA golden cross, if the closing price is lower than the highest price of the day, a buy signal is generated; if the closing price is higher than the lowest price of the day, a sell signal is generated. This filters out some unstable trading signals.
Advantages of the Strategy
The main advantage of this strategy lies in using the EMA indicator to determine the main buy and sell points. The EMA indicator is a commonly used and practical technical indicator that can effectively smooth price fluctuations and determine the general trend of stock prices. Compared to complex indicators, the EMA is simple and intuitive, easy to implement for automated trading.
In addition, combining intraday highs and lows for auxiliary judgment can further improve signal quality and filter out some false signals. This idea of combining technical indicators is worth promoting.
Overall, this strategy is simple, practical, easy to understand and use, and highly suitable for automated implementation in quantitative trading. This is the biggest advantage of the strategy.
Risks of the Strategy
Although the strategy uses a simple and effective EMA indicator, any technical indicator may fail at times. Especially in times of violent price fluctuations, EMA lines can lag, leading to delayed trading signals and thus missing the best buy and sell timing. This is the main risk facing the strategy.
In addition, although the auxiliary judgment conditions can filter out false signals, it may also filter out some real signals, resulting in insufficient signals. This will also affect strategy performance.
Finally, the strategy is designed solely on technical indicator rules without considering fundamentals. If the company's fundamentals change dramatically, the market may see large, unpredictable moves that technical indicators fail to foresee. The trading signals from the strategy can become completely invalid.
Optimization of the Strategy
The strategy can be optimized in the following aspects:
-
Adjust EMA parameters to adapt to more market conditions. Adaptive EMA lengths can be set based on the degree of market volatility.
-
Increase other technical indicators for combination. For example, adding the MACD indicator to determine buy and sell points can improve signal accuracy. Or use graphical indicators like candlestick patterns for assistance.
-
Increase machine learning models to predict market conditions and aid in AI judgment of buy and sell points. This can overcome the limitations of pure rules-based trading.
-
Consider company fundamentals and macro policies. Adding these factors allows strategies to cope with more complex market conditions.
Summary
The Mayan Treasure Hunting Guide is a simple and intuitive stock trading strategy. It uses the widely recognized EMA line to determine price trends and confirm trading signals. At the same time, it uses price highs and lows to filter and improve signal quality. The strategy is easy to understand and use, suitable for automated quantitative trading. But it also has potential risks such as technical indicator failure. Future improvements can be made from multiple perspectives like parameter tuning, signal enhancement, and introducing machine learning to improve strategy effectiveness.
- 1