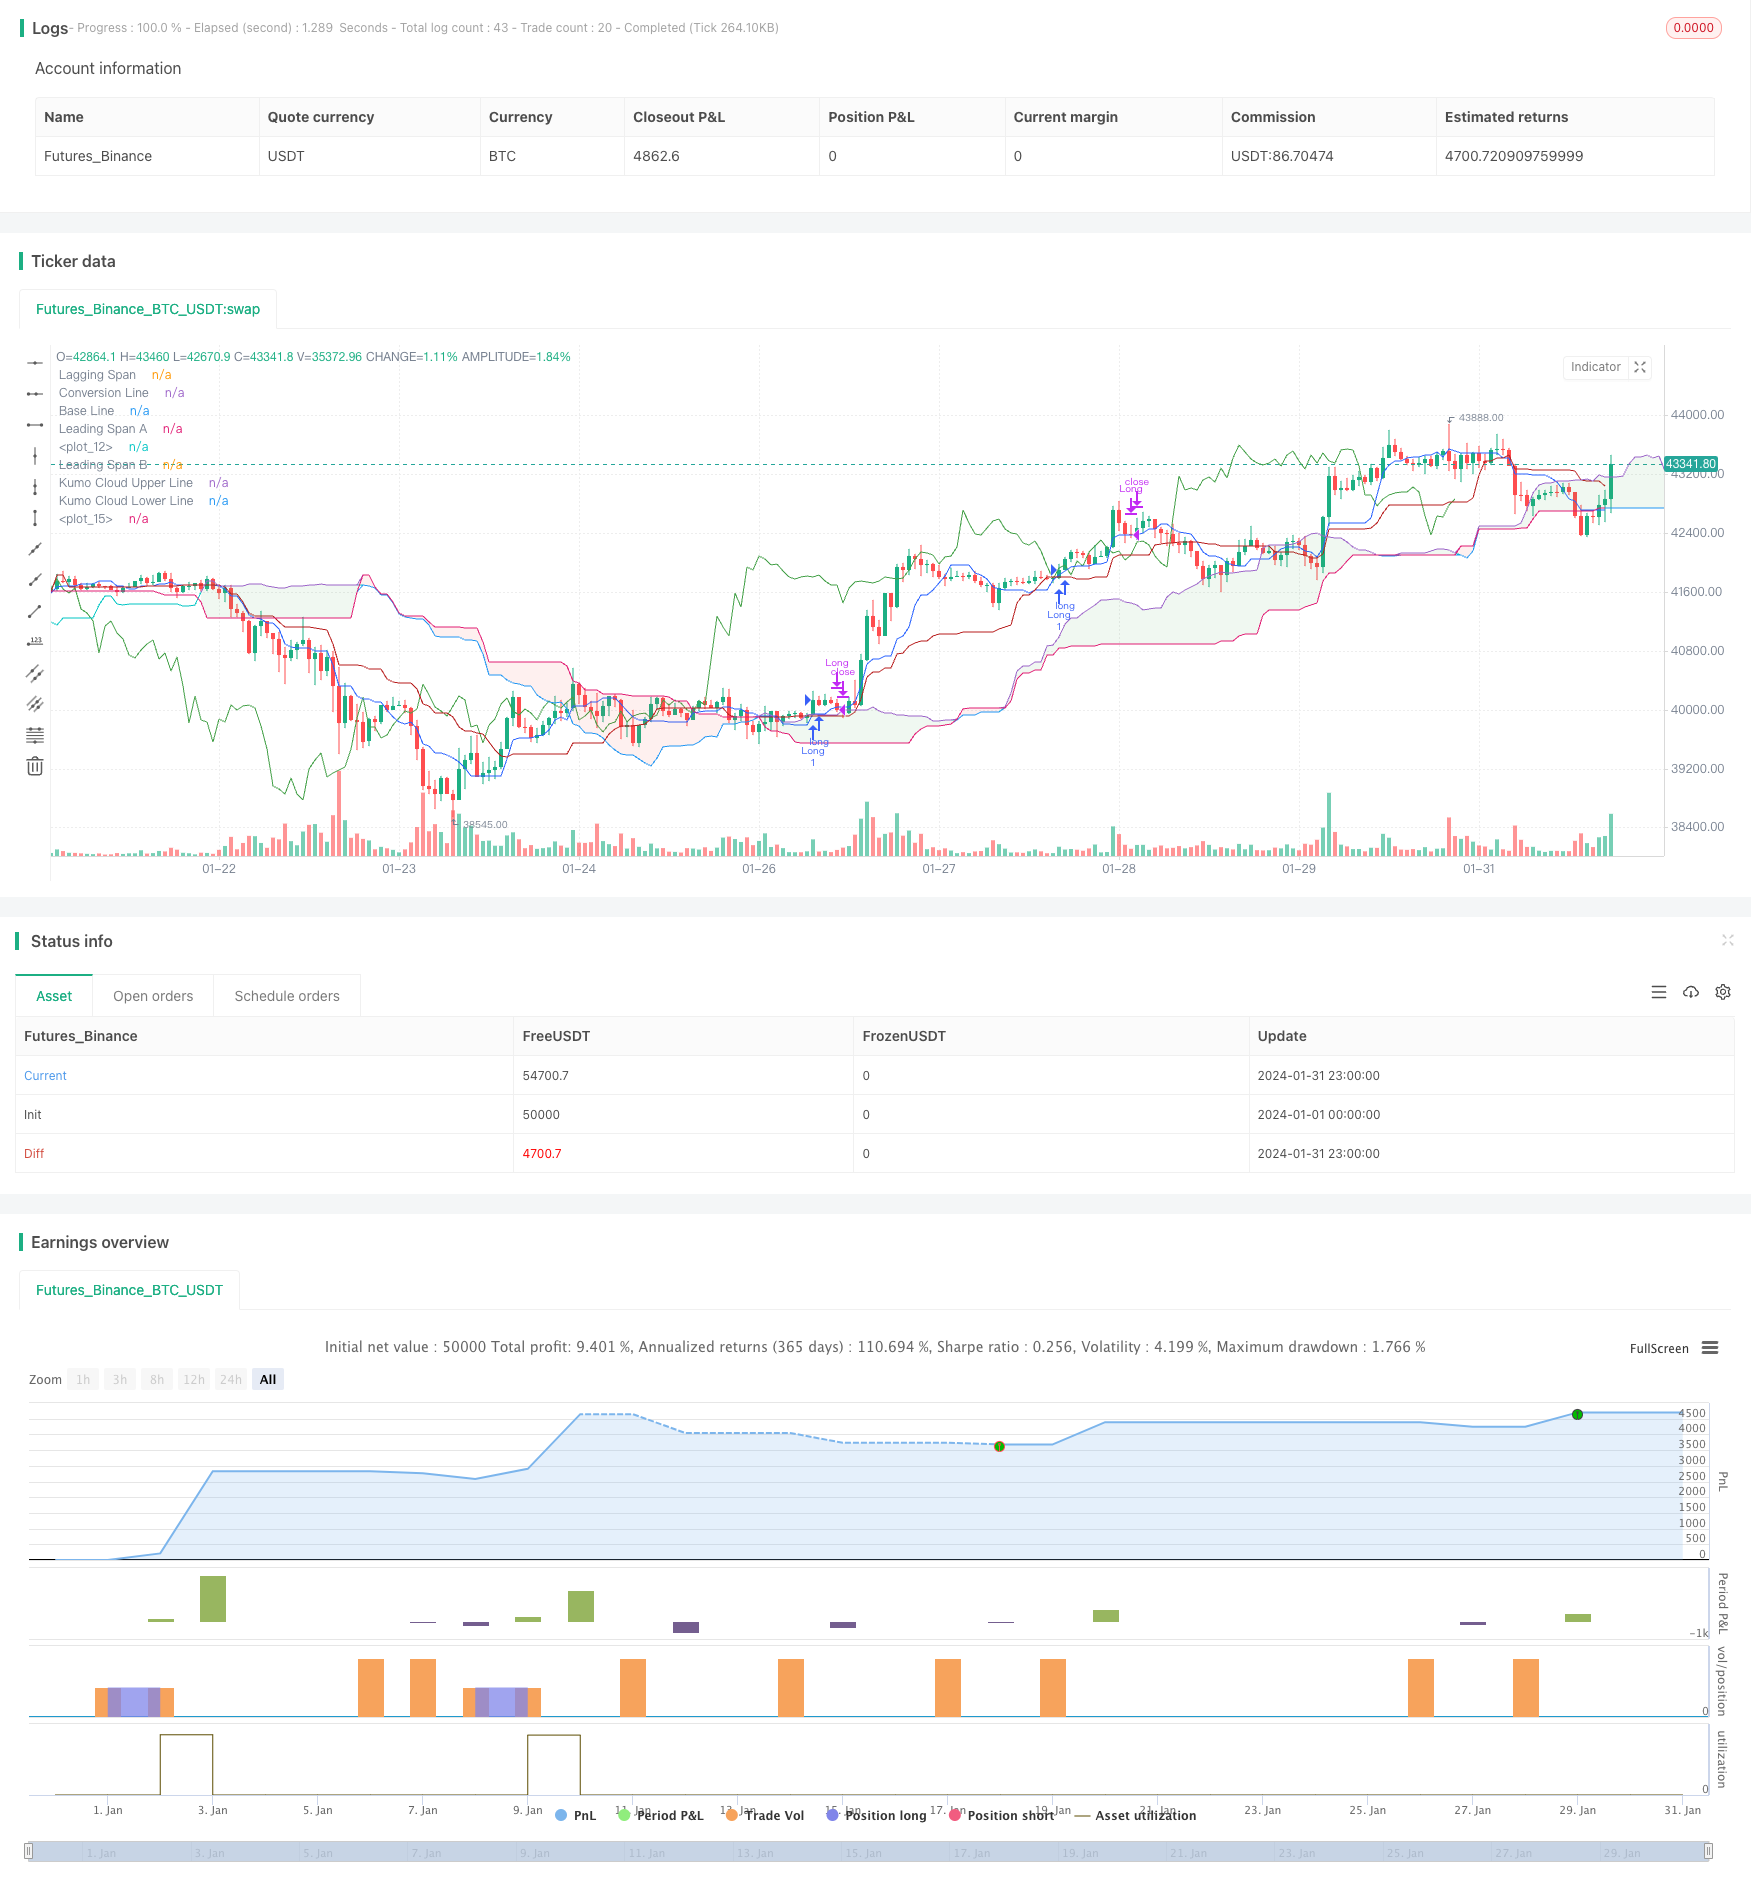
概述
一目均衡图趋势追踪策略(Ichimoku Cloud Trend Following Strategy)是一种技术分析策略。它利用一目均衡图的五条指标线,判断市场趋势方向、支持阻力位和进场时机。
原理
该策略的核心指标线包含:
- 转换线:最近9日高点与低点的平均值,反映短期趋势。
- 基准线:最近26日高点与低点的平均值,反映中长期趋势。
- 先行线A:转换线与基准线的平均值,位移26日,判断中期支撑与阻力。
- 先行线B:最近52日高点与低点的平均值,位移26日,判断长期支撑与阻力。
- 随动线:价格位移26日,反映趋势动量。
当转换线上穿基准线时为买入信号;下穿为卖出信号。随动线位于价格之上且云团颜色为绿色为多头趋势,否则为空头。
策略根据转换线和基准线的关系判断趋势方向。比如,转换线向上突破基准线则判断为进入多头,此时如果满足随动线高于价格的条件,则产生买入信号。
止损或止盈依据先行线A或基准线来设置。如果选择基准线止损,当价格跌破基准线时平仓。
优势分析
该策略具有以下优势:
- 利用多指标综合判断,提高精确度。
- 先行线可提前判断支撑与阻力。
- 随动线验证趋势动量,防止虚假突破。
- 基准线作为中长期趋势指标,可减少噪音交易。
风险及优化
该策略主要风险在于容易产生虚假信号。优化建议:
- 调整平均周期参数,优化指标灵敏度。
- 添加其他指标或图形过滤,如MACD、布林带。
- 降低交易频率,追踪中长线趋势。
总结
一目均衡图策略综合多指标判断市场走势,既考量短期动量,也重视中长期趋势。转换线与基准线的关系判断市场买卖时机,基准线作为止损线锁定利润,可有效控制风险。该策略适合中长线追踪趋势交易。
策略源码
/*backtest
start: 2024-01-01 00:00:00
end: 2024-01-31 23:59:59
period: 1h
basePeriod: 15m
exchanges: [{"eid":"Futures_Binance","currency":"BTC_USDT"}]
*/

//@version=5
strategy(title="Ichimoku Cloud - BitBell", shorttitle="Ichimoku Cloud - BitBell", overlay=true)
conversionPeriods = input.int(9, minval=1, title="Conversion Line Length")
basePeriods = input.int(26, minval=1, title="Base Line Length")
laggingSpan2Periods = input.int(52, minval=1, title="Leading Span B Length")
displacement = input.int(26, minval=1, title="Lagging Span")
donchian(len) => math.avg(ta.lowest(len), ta.highest(len))
conversionLine = donchian(conversionPeriods)
baseLine = donchian(basePeriods)
leadLine1 = math.avg(conversionLine, baseLine)
leadLine1bbbbb = math.avg(conversionLine, baseLine)[displacement - 1]
plot(leadLine1bbbbb)
leadLine2 = donchian(laggingSpan2Periods)
leadLine2bbbbbb = donchian(laggingSpan2Periods)[displacement - 1]
plot(leadLine2bbbbbb)

support = leadLine1bbbbb > leadLine2bbbbbb
Resistance = leadLine1bbbbb < leadLine2bbbbbb


TrailStop = input.string(title='Choose Trail Line', options=["ConversionLine", "BaseLine"], defval="ConversionLine")


var stopLong = 0.0
var stopShort = 0.0
var TagetLong = 0.0
var TargetShort = 0.0


if close > leadLine1bbbbb and close > leadLine2bbbbbb and conversionLine[1] <= baseLine[1] and conversionLine > baseLine and close > conversionLine and support
	strategy.entry("Long",strategy.long)
	stopLong := conversionLine
// if close < stopLong and strategy.position_size > 0
// 	strategy.close("Long")
// 	stopLong := 0.0
if (close < conversionLine and strategy.position_size > 0) and (TrailStop == 'ConversionLine')
	strategy.close("Long")
	stopLong := 0.0
if (close < baseLine and strategy.position_size > 0) and (TrailStop == 'BaseLine')
	strategy.close("Long")
	stopLong := 0.0

if close < leadLine1bbbbb and close < leadLine2bbbbbb and conversionLine[1] >= baseLine[1] and conversionLine < baseLine and close < conversionLine and Resistance
	strategy.entry("Short",strategy.short)
	stopShort := conversionLine
// if close > stopShort and strategy.position_size < 0
// 	strategy.close("Short")
// 	stopShort := 0.0
if (close > conversionLine and strategy.position_size < 0) and (TrailStop == 'ConversionLine')
	strategy.close("Short")
	stopShort := 0.0
if (close > baseLine and strategy.position_size < 0) and (TrailStop == 'BaseLine')
	strategy.close("Short")
	stopShort := 0.0
// if close >= 1.0006 * strategy.position_avg_price and strategy.position_size > 0
// 	strategy.close("Long")
// 	stopLong := 0.0
plot(conversionLine, color=#2962FF, title="Conversion Line")
plot(baseLine, color=#B71C1C, title="Base Line")
plot(close, offset = -displacement + 1, color=#43A047, title="Lagging Span")
p1 = plot(leadLine1, offset = displacement - 1, color=#A5D6A7,
	 title="Leading Span A")
p2 = plot(leadLine2, offset = displacement - 1, color=#EF9A9A,
	 title="Leading Span B")
plot(leadLine1 > leadLine2 ? leadLine1 : leadLine2, offset = displacement - 1, title = "Kumo Cloud Upper Line", display = display.none)
plot(leadLine1 < leadLine2 ? leadLine1 : leadLine2, offset = displacement - 1, title = "Kumo Cloud Lower Line", display = display.none)
fill(p1, p2, color = leadLine1 > leadLine2 ? color.rgb(67, 160, 71, 90) : color.rgb(244, 67, 54, 90))