Momentum Line Crossover EMA Nine Stock MACD Strategy

Author: ChaoZhang, Date: 2024-02-27 16:49:10
Tags:

img

Overview

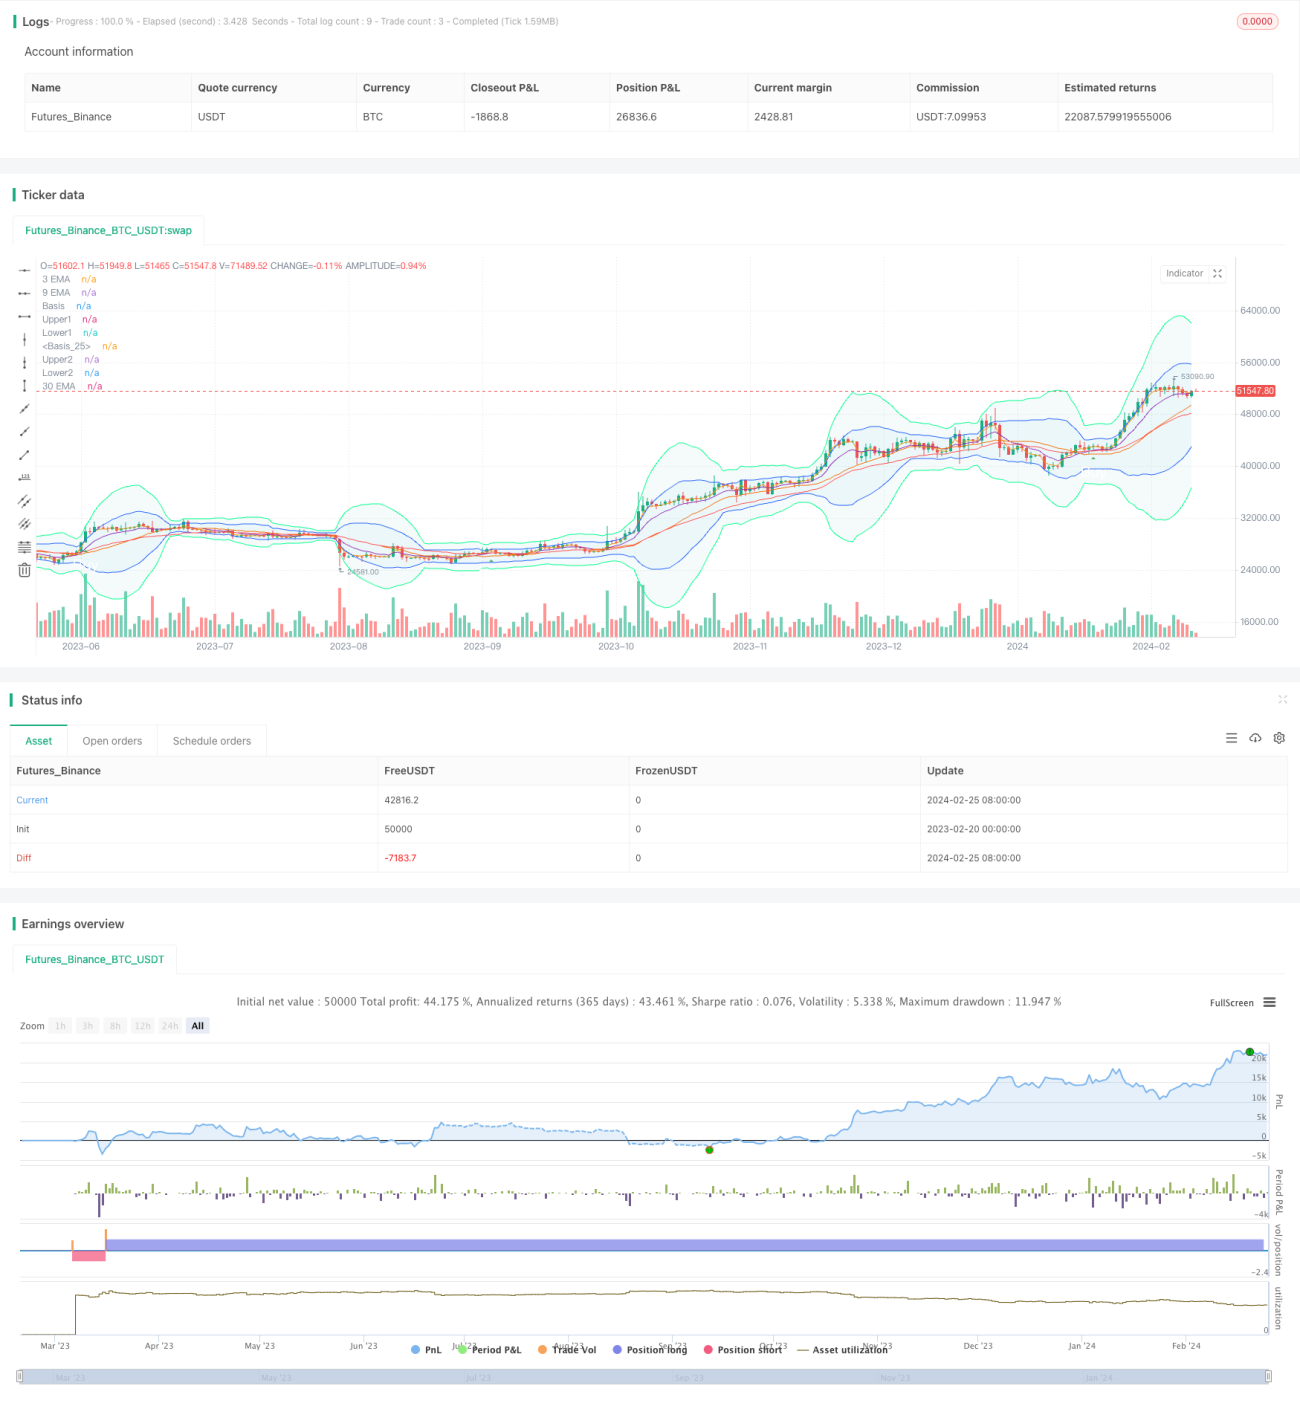
This strategy comprehensively utilizes the EMA indicator, Bollinger Bands indicator and MACD indicator. On the basis of the golden cross and death cross of the 9-day EMA and 30-day EMA, it determines the timing of buying and selling in combination with the price distribution range and momentum indicators.

Strategy Principle

  1. Calculate the 3-day EMA, 9-day EMA and 30-day EMA.

  2. Calculate the standard deviation within 20 days of the price and draw the Bollinger Bands with 1 and 2 times the standard deviation.

  3. Calculate the 12-day, 26-day MACD and 9-day signal line.

  4. When the 9-day EMA goes above the 30-day EMA, and the price exceeds the upper limit of the 1x standard deviation Bollinger Bands, a buy signal is issued.

  5. When the 30-day EMA goes below the 9-day EMA, and the price is lower than the lower limit of the 1x standard deviation Bollinger Bands, a sell signal is issued.

Advantage Analysis

By combining moving average indicators and momentum indicators, this strategy can better grasp market trends and timing, with the following advantages:

  1. The EMA indicator can respond quickly to price changes to determine market trends; the MACD indicator judges momentum to prevent false breakouts.

  2. The combination of Bollinger Bands standard deviation indicators and EMAs can more accurately determine the timing of buying and selling.

  3. The combination of multiple indicators can complement each other. Different indicators can verify the judgment in one breakthrough.

Risk and Optimization Analysis

This strategy also has some risks. Pay attention to the following points for optimization:

  1. The combination of EMA moving averages can be adjusted and optimized. Different cycles can better capture trends.

  2. The parameters of Bollinger Bands can be optimized by changing the multiplication of standard deviations to filter out false signals.

  3. The parameters and combination of the MACD indicator can be optimized to improve the effect of judging momentum.

Summary

This strategy integrates the EMA indicator to determine the major trend, supplemented by the Bollinger Bands indicator which can accurately seize buy and sell points when momentum is relatively large; the MACD indicator supplements trend confirmation and can effectively filter out false signals. Through parameter optimization, the effect of this strategy can be further improved.


/*backtest
start: 2023-02-20 00:00:00
end: 2024-02-26 00:00:00
period: 1d
basePeriod: 1h
exchanges: [{"eid":"Futures_Binance","currency":"BTC_USDT"}]
*/

//@version=5
strategy("emabb_collab", shorttitle="emabb", overlay=true)

// Input parameters
ema3 = input(3, title="3 EMA")
ema9 = input(9, title="9 EMA")
ema30 = input(30, title="30 EMA")
macdShort = input(12, title="MACD Short")
macdLong = input(26, title="MACD Long")
macdSignal = input(9, title="MACD Signal")
length = input.int(20, minval=1)
src = input(close, title="Source")
mult = input.float(2.0, minval=0.001, maxval=50, title="StdDev")
basis = ta.sma(src, length)
dev1 = mult * ta.stdev(src, length)
upper1 = basis + dev1
lower1 = basis - dev1
dev2 = mult * 2 * ta.stdev(src, length)
upper2 = basis + dev2
lower2 = basis - dev2
plot(basis, "Basis", color=#FF6D00)
p1 = plot(upper1, "Upper1", color=#2962FF)
p2 = plot(lower1, "Lower1", color=#2962FF)
fill(p1, p2, title = "Background", color=color.rgb(33, 150, 243, 95))
plot(basis, "Basis", color=#FF6D00)
p3 = plot(upper2, "Upper2", color=#00FF8C)
p4 = plot(lower2, "Lower2", color=#00FF8C)
fill(p3, p4, title = "Background", color=color.rgb(0, 153, 140, 95))

// Calculate EMAs
ema3Value = ta.ema(close, ema3)
ema9Value = ta.ema(close, ema9)
ema30Value = ta.ema(close, ema30)


// Calculate MACD
[macdLine, signalLine, _] = ta.macd(close, macdShort, macdLong, macdSignal)


// Conditions for buy signal
buyCondition = ta.crossover(ema9Value, ema30Value)  and ta.stdev(close, 20) > ta.stdev(close, 20)[1]

//Conditions for sell signal
sellCondition = ta.crossover(ema30Value, ema9Value)  and ta.stdev(close, 20) < ta.stdev(close, 20)[1]

// Plot signals on the chart

plotshape(buyCondition, title='Buy Label', style=shape.triangleup, location=location.belowbar, size=size.normal, text='Buy', textcolor=color.new(color.white, 0), color=color.new(color.green, 0))
plotshape(sellCondition, title='sell Label', style=shape.triangledown, location=location.abovebar, size=size.normal, text='sell', textcolor=color.new(color.white, 0), color=color.new(color.red, 0))

// Plot EMAs
plot(ema3Value, title="3 EMA", color=color.orange)
plot(ema9Value, title="9 EMA", color=color.purple)
plot(ema30Value, title="30 EMA", color=color.red)


if buyCondition
    strategy.entry('Long', strategy.long)
if sellCondition
    strategy.entry('Short', strategy.short)


More