Multi-Timeframe Trend Trading Strategy Based on Compressed Indicators

Author: ChaoZhang, Date: 2024-02-27 17:40:03
Tags:

img

Overview

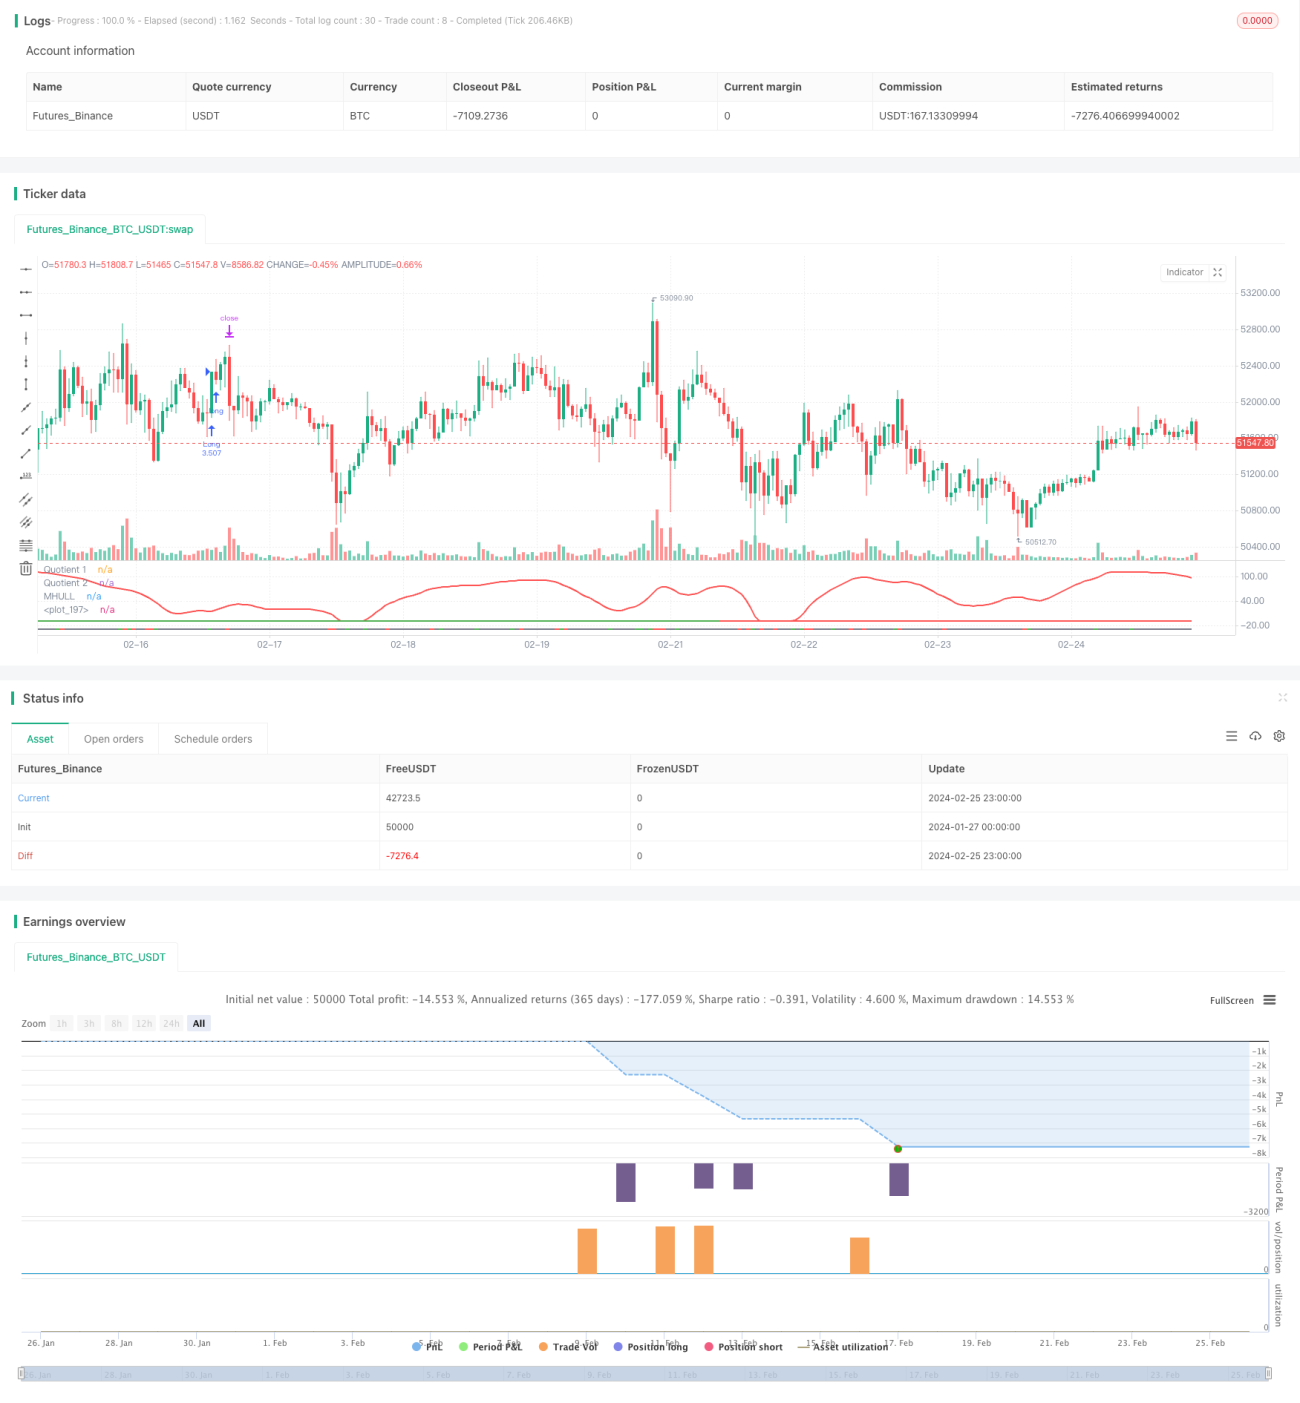
This strategy combines the Boom Hunter, Hull Suite, and Volatility Oscillator indicators to implement a quantitative strategy for trend tracking and breakout trading across multiple timeframes. It is suitable for digital assets with high volatility and abrupt price moves like Bitcoin.

Principles

The core logic of this strategy is based on the following three indicators:

  1. Boom Hunter: An oscillator that uses indicator compression techniques to generate trading signals from crossovers between two quotients (Quotient1 and Quotient2).

  2. Hull Suite: A set of smoothed moving average lines that determine trend direction based on the relationship between the midline and upper/lower bands.

  3. Volatility Oscillator: An oscillator indicator that quantifies price volatility.

The entry logic of this strategy is when the two Quotient indicators of the Boom Hunter cross up or down, the price breaks through the Hull midline and diverges from the upper or lower band, meanwhile the Volatility Oscillator is in overbought/oversold area. This filters out some false breakout signals and improves entry accuracy.

The stop loss is set by finding the lowest valley or highest peak over a certain period (default 20 bars), and take profit is obtained by multiplying the stop loss percentage by a configured profit factor (default 3x). Position sizing is calculated based on a percentage of total account equity (default 3%) and the specific stop loss range of the instrument.

Pros

  • Extracts key trading signals from price using indicator compression techniques, improving profitability
  • Combination of multiple indicators prevents false breakouts and accurately determines trend direction
  • Dynamic stop loss and take profit setting allows risk-controlled trend following
  • Ensures trading in high volatility environments using the Volatility Oscillator
  • Enhanced strategy stability through multi-timeframe analysis

Risks

  • Boom Hunter indicators can have compression distortions, generating incorrect signals
  • Hull midline may lag and unable to track price changes in real time
  • Missing trading opportunities or forced liquidations during volatility contraction

Solutions:

  1. Adjust compression indicator parameters to balance sensitivity
  2. Try exponential moving averages instead of the midline
  3. Add other judgment indicators to avoid volatility misdirection

Optimization

This strategy can be optimized in the following aspects:

  1. Parameter Optimization: Obtain best parameter combinations by tweaking indicator settings like period and compression coefficient

  2. Timeframe Optimization: Test different periods (1min, 5min, 30min etc.) to find the optimal trading timeframe

  3. Position Sizing Optimization: Change per trade position size and ratio to find the ideal capital utilization plan

  4. Stop Loss Optimization: Adjust stop loss placement based on different trading instruments to achieve optimal risk-reward ratio

  5. Condition Optimization: Add/reduce indicator filters to obtain more accurate entry signals

Conclusion

This strategy combines Boom Hunter, Hull Suite and Volatility Oscillator to implement multi-timeframe trend tracking trading, effectively identifying abrupt price behaviors suitable for highly volatile digital assets. With controllable risks, strong practicality and extensibility through parameter tuning, filter conditions and stop loss optimization, it is an exemplary quantitative model.


/*backtest
start: 2024-01-27 00:00:00
end: 2024-02-26 00:00:00
period: 1h
basePeriod: 15m
exchanges: [{"eid":"Futures_Binance","currency":"BTC_USDT"}]
*/

// Strategy based on the 3 indicators:
//  - Boom Hunter Pro
//  - Hull Suite
//  - Volatility Oscillator
//
// Strategy was designed for the purpose of back testing. 
// See strategy documentation for info on trade entry logic.
// 
// Credits:
//  - Boom Hunter Pro: veryfid (https://www.tradingview.com/u/veryfid/)
//  - Hull Suite: InSilico (https://www.tradingview.com/u/InSilico/)
//  - Volatility Oscillator: veryfid (https://www.tradingview.com/u/veryfid/)

//@version=5
strategy("Boom Hunter + Hull Suite + Volatility Oscillator Strategy", overlay=false, initial_capital=1000, currency=currency.NONE, max_labels_count=500, default_qty_type=strategy.cash, commission_type=strategy.commission.percent, commission_value=0.01)

// =============================================================================
// STRATEGY INPUT SETTINGS
// =============================================================================

// ---------------
// Risk Management
// ---------------
swingLength = input.int(20, "Swing High/Low Lookback Length", group='Strategy: Risk Management', tooltip='Stop Loss is calculated by the swing high or low over the previous X candles')
accountRiskPercent = input.float(3, "Account percent loss per trade", step=0.1, group='Strategy: Risk Management', tooltip='Each trade will risk X% of the account balance')
profitFactor = input.float(3, "Profit Factor (R:R Ratio)", step = 0.1, group='Strategy: Risk Management')

// ----------
// Date Range
// ----------
start_year = input.int(title='Start Date', defval=2022, minval=2010, maxval=3000, group='Strategy: Date Range', inline='1')
start_month = input.int(title='', defval=1, group='Strategy: Date Range', inline='1', options = [1, 2, 3, 4, 5, 6, 7, 8, 9, 10, 11, 12])
start_date = input.int(title='', defval=1, group='Strategy: Date Range', inline='1', options = [1, 2, 3, 4, 5, 6, 7, 8, 9, 10, 11, 12, 13, 14, 15, 16, 17, 18, 19, 20, 21, 22, 23, 24, 25, 26, 27, 28, 29, 30, 31])
end_year = input.int(title='End Date', defval=2023, minval=1800, maxval=3000, group='Strategy: Date Range', inline='2')
end_month = input.int(title='', defval=1, group='Strategy: Date Range', inline='2', options = [1, 2, 3, 4, 5, 6, 7, 8, 9, 10, 11, 12])
end_date = input.int(title='', defval=1, group='Strategy: Date Range', inline='2', options = [1, 2, 3, 4, 5, 6, 7, 8, 9, 10, 11, 12, 13, 14, 15, 16, 17, 18, 19, 20, 21, 22, 23, 24, 25, 26, 27, 28, 29, 30, 31])
in_date_range = true

// =============================================================================
// INDICATORS
// =============================================================================

// ---------------
// Boom Hunter Pro
// ---------------
square = input.bool(true, title='Square Line?', group='Main Settings')
//Quotient
LPPeriod = input.int(6, title='Quotient | LPPeriod', inline='quotient', group='EOT 1 (Main Oscillator)')
K1 = input.int(0, title='K1', inline='quotient', group='EOT 1 (Main Oscillator)')
esize = 60  //, title = "Size", inline = "quotient2", group = "EOT 1 (Main Oscillator)")
ey = 50  //, title = "Y axis", inline = "quotient2", group = "EOT 1 (Main Oscillator)")
trigno = input.int(1, 'Trigger Length', group='EOT 1 (Main Oscillator)', inline='quotient2')
trigcol = input.color(color.white, title='Trigger Color:', group='EOT 1 (Main Oscillator)', inline='q2')

// EOT 2
//Inputs
LPPeriod2 = input.int(28, title='LPPeriod2', group='EOT 2 (Red Wave)', inline='q2')
K22 = input.float(0.3, title='K2', group='EOT 2 (Red Wave)', inline='q2')

//EOT 1
//Vars
alpha1 = 0.00
HP = 0.00
a1 = 0.00
b1 = 0.00
c1 = 0.00
c2 = 0.00
c3 = 0.00
Filt = 0.00
Peak = 0.00
X = 0.00
Quotient1 = 0.00
pi = 2 * math.asin(1)

//Highpass filter cyclic components
//whose periods are shorter than 100 bars
alpha1 := (math.cos(.707 * 2 * pi / 100) + math.sin(.707 * 2 * pi / 100) - 1) / math.cos(.707 * 2 * pi / 100)
HP := (1 - alpha1 / 2) * (1 - alpha1 / 2) * (close - 2 * nz(close[1]) + nz(close[2])) + 2 * (1 - alpha1) * nz(HP[1]) - (1 - alpha1) * (1 - alpha1) * nz(HP[2])

//SuperSmoother Filter
a1 := math.exp(-1.414 * pi / LPPeriod)
b1 := 2 * a1 * math.cos(1.414 * pi / LPPeriod)
c2 := b1
c3 := -a1 * a1
c1 := 1 - c2 - c3
Filt := c1 * (HP + nz(HP[1])) / 2 + c2 * nz(Filt[1]) + c3 * nz(Filt[2])

//Fast Attack - Slow Decay Algorithm
Peak := .991 * nz(Peak[1])
if math.abs(Filt) > Peak
    Peak := math.abs(Filt)
    Peak

//Normalized Roofing Filter
if Peak != 0
    X := Filt / Peak
    X

Quotient1 := (X + K1) / (K1 * X + 1)

// EOT 2
//Vars
alpha1222 = 0.00
HP2 = 0.00
a12 = 0.00
b12 = 0.00
c12 = 0.00
c22 = 0.00
c32 = 0.00
Filt2 = 0.00
Peak2 = 0.00
X2 = 0.00
Quotient4 = 0.00

alpha1222 := (math.cos(.707 * 2 * pi / 100) + math.sin(.707 * 2 * pi / 100) - 1) / math.cos(.707 * 2 * pi / 100)
HP2 := (1 - alpha1222 / 2) * (1 - alpha1222 / 2) * (close - 2 * nz(close[1]) + nz(close[2])) + 2 * (1 - alpha1222) * nz(HP2[1]) - (1 - alpha1222) * (1 - alpha1222) * nz(HP2[2])

//SuperSmoother Filter
a12 := math.exp(-1.414 * pi / LPPeriod2)
b12 := 2 * a12 * math.cos(1.414 * pi / LPPeriod2)
c22 := b12
c32 := -a12 * a12
c12 := 1 - c22 - c32
Filt2 := c12 * (HP2 + nz(HP2[1])) / 2 + c22 * nz(Filt2[1]) + c32 * nz(Filt2[2])

//Fast Attack - Slow Decay Algorithm
Peak2 := .991 * nz(Peak2[1])
if math.abs(Filt2) > Peak2
    Peak2 := math.abs(Filt2)
    Peak2

//Normalized Roofing Filter
if Peak2 != 0
    X2 := Filt2 / Peak2
    X2

Quotient4 := (X2 + K22) / (K22 * X2 + 1)
q4 = Quotient4 * esize + ey

//Plot EOT
q1 = Quotient1 * esize + ey
trigger = ta.sma(q1, trigno)
Plot3 = plot(trigger, color=trigcol, linewidth=2, title='Quotient 1')
Plot44 = plot(q4, color=color.new(color.red, 0), linewidth=2, title='Quotient 2')


// ----------
// HULL SUITE
// ----------

//INPUT
src = input(close, title='Source')
modeSwitch = input.string('Hma', title='Hull Variation', options=['Hma', 'Thma', 'Ehma'])
length = input(200, title='Length(180-200 for floating S/R , 55 for swing entry)')
lengthMult = input(2.4, title='Length multiplier (Used to view higher timeframes with straight band)')

useHtf = input(false, title='Show Hull MA from X timeframe? (good for scalping)')
htf = input.timeframe('240', title='Higher timeframe')

//FUNCTIONS
//HMA
HMA(_src, _length) =>
    ta.wma(2 * ta.wma(_src, _length / 2) - ta.wma(_src, _length), math.round(math.sqrt(_length)))
//EHMA    
EHMA(_src, _length) =>
    ta.ema(2 * ta.ema(_src, _length / 2) - ta.ema(_src, _length), math.round(math.sqrt(_length)))
//THMA    
THMA(_src, _length) =>
    ta.wma(ta.wma(_src, _length / 3) * 3 - ta.wma(_src, _length / 2) - ta.wma(_src, _length), _length)

//SWITCH
Mode(modeSwitch, src, len) =>
    modeSwitch == 'Hma' ? HMA(src, len) : modeSwitch == 'Ehma' ? EHMA(src, len) : modeSwitch == 'Thma' ? THMA(src, len / 2) : na

//OUT
_hull = Mode(modeSwitch, src, int(length * lengthMult))
HULL = useHtf ? request.security(syminfo.ticker, htf, _hull) : _hull
MHULL = HULL[0]
SHULL = HULL[2]

//COLOR
hullColor = MHULL > SHULL ? color.green : color.red

//PLOT
///< Frame
Fi1 = plot(-10, title='MHULL', color=hullColor, linewidth=2)

// -----------------
// VOLUME OSCILLATOR
// -----------------

volLength = input(80)
spike = close - open
x = ta.stdev(spike, volLength)
y = ta.stdev(spike, volLength) * -1
volOscCol = spike > x ? color.green : spike < y ? color.red : color.gray
plot(-30, color=color.new(volOscCol, transp=0), linewidth=2)


// =============================================================================
// STRATEGY LOGIC
// =============================================================================

// Boom Hunter Pro entry conditions
boomLong = ta.crossover(trigger, q4)
boomShort = ta.crossunder(trigger, q4)

// Hull Suite entry conditions
hullLong = MHULL > SHULL and close > MHULL
hullShort = MHULL < SHULL and close < SHULL

// Volatility Oscillator entry conditions
volLong = spike > x
volShort = spike < y

inLong = strategy.position_size > 0
inShort = strategy.position_size < 0

longCondition = boomLong and hullLong and volLong and in_date_range
shortCondition = boomShort and hullShort and volShort and in_date_range

swingLow = ta.lowest(source=low, length=swingLength)
swingHigh = ta.highest(source=high, length=swingLength)

atr = ta.atr(14)
longSl = math.min(close - atr, swingLow)
shortSl = math.max(close + atr, swingHigh)

longStopPercent = math.abs((1 - (longSl / close)) * 100)
shortStopPercent = math.abs((1 - (shortSl / close)) * 100)

longTpPercent = longStopPercent * profitFactor
shortTpPercent = shortStopPercent * profitFactor
longTp = close + (close * (longTpPercent / 100))
shortTp = close - (close * (shortTpPercent / 100))

// Position sizing (default risk 3% per trade)
riskAmt = strategy.equity * accountRiskPercent / 100
longQty = math.abs(riskAmt / longStopPercent * 100) / close
shortQty = math.abs(riskAmt / shortStopPercent * 100) / close

if (longCondition and not inLong)
    strategy.entry("Long", strategy.long, qty=longQty)
    strategy.exit("Long  SL/TP", from_entry="Long", stop=longSl, limit=longTp, alert_message='Long SL Hit')
    buyLabel = label.new(x=bar_index, y=high[1], color=color.green, style=label.style_label_up)
    label.set_y(id=buyLabel, y=-40)
    label.set_tooltip(id=buyLabel, tooltip="Risk Amt: " + str.tostring(riskAmt) + " Qty: " + str.tostring(longQty) + " Swing low: " + str.tostring(swingLow) + " Stop Percent: " + str.tostring(longStopPercent) + " TP Percent: " + str.tostring(longTpPercent))

if (shortCondition and not inShort)
    strategy.entry("Short", strategy.short, qty=shortQty)
    strategy.exit("Short  SL/TP", from_entry="Short", stop=shortSl, limit=shortTp, alert_message='Short SL Hit')
    sellLabel = label.new(x=bar_index, y=high[1], color=color.red, style=label.style_label_up)
    label.set_y(id=sellLabel, y=-40)
    label.set_tooltip(id=sellLabel, tooltip="Risk Amt: " + str.tostring(riskAmt) + " Qty: " + str.tostring(shortQty) + " Swing high: " + str.tostring(swingHigh) + " Stop Percent: " + str.tostring(shortStopPercent) + " TP Percent: " + str.tostring(shortTpPercent))


More