Bollinger Bands Breakout Trend Trading Strategy

Overview
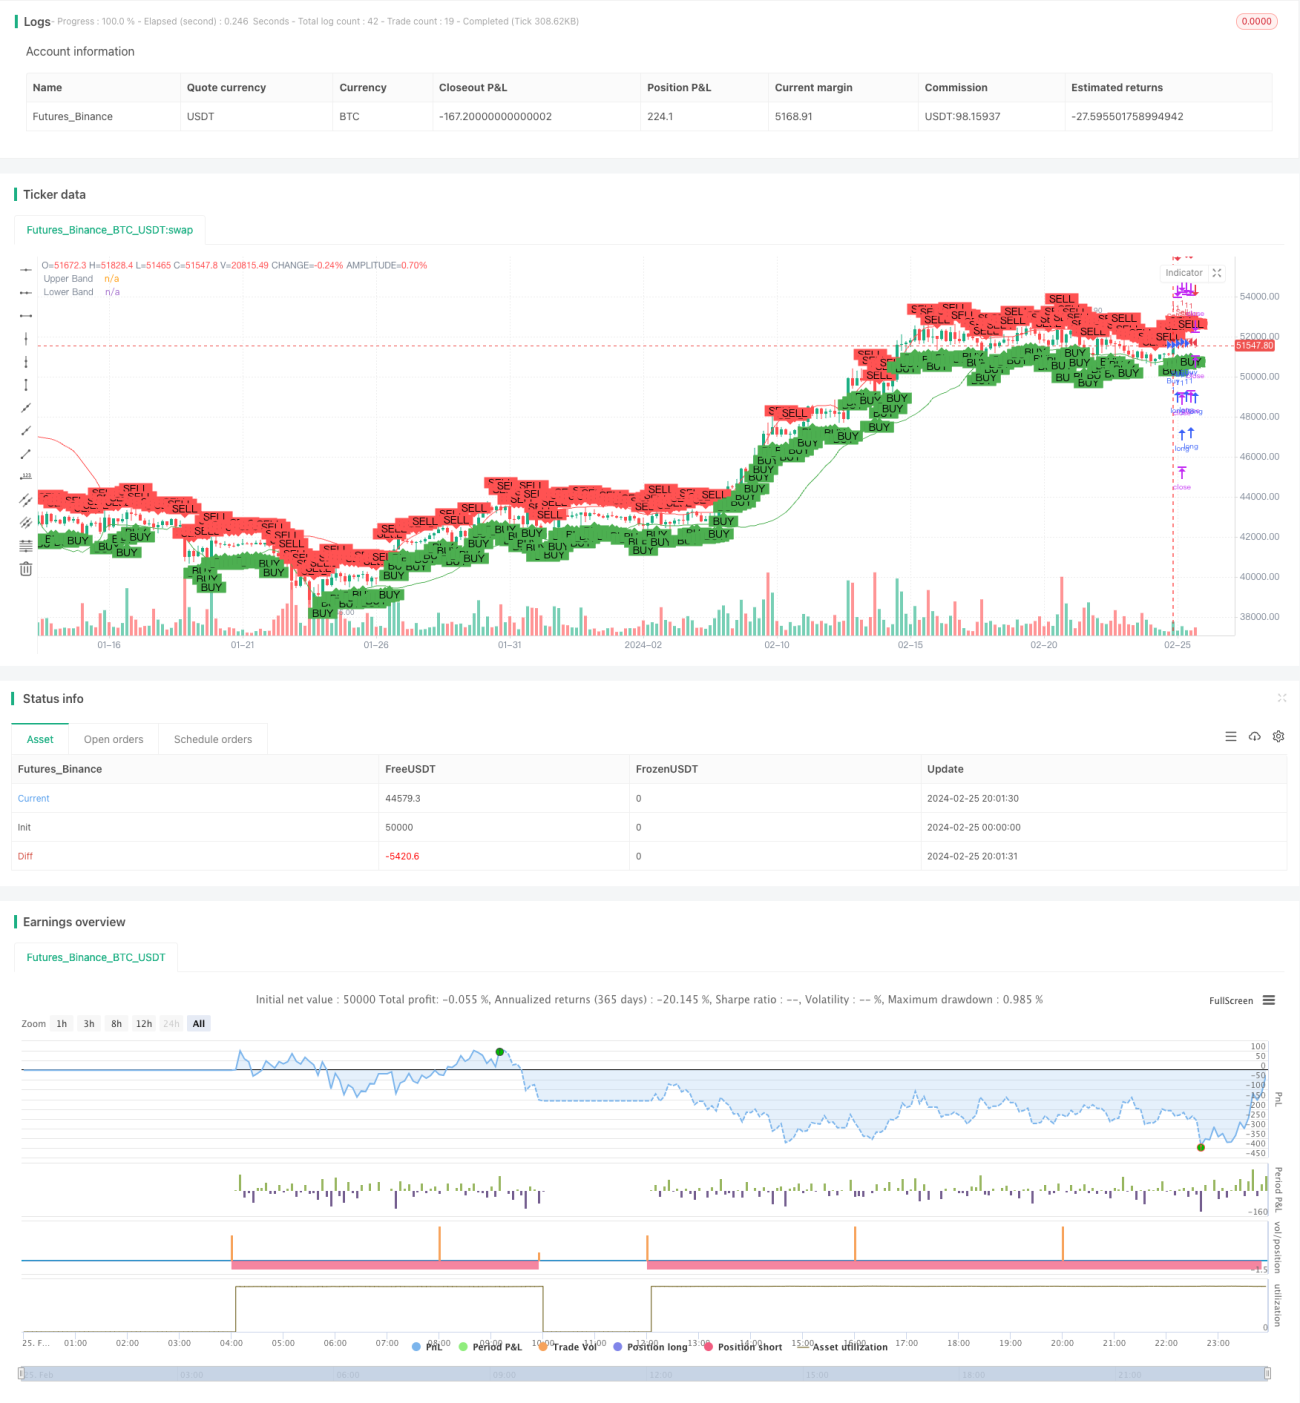
The Bollinger Bands Breakout Trend Trading Strategy is designed to identify potential trend reversals at extreme price levels relative to recent volatility. It combines Bollinger Bands as a mean reversion indicator with breakout logic across the bands to catch the start of new trends.
Strategy Logic
The core strategy logic consists of the following components:
-
Bollinger Bands plotted as a 20-period EMA +/- 1.5 standard deviations to identify upper and lower bands.
-
Tracking when the price closes outside the Bollinger Bands 2 periods ago to anticipate potential reversals.
-
Entry signals triggered when the current bar breaks the high/low of the candle from 2 periods ago that closed beyond the opposite band.
-
Stop loss set just outside the high/low of the current bar.
-
Take profit based on predefined risk-reward ratio.
Advantages
The key advantages of this strategy are:
-
Bollinger Bands adapt to changing market volatility. Wider bands in volatile markets reduce likelihood of false signals.
-
Aiming to catch trend reversals early as price breaks back inside the bands.
-
Flexible risk management with adjustable risk-reward ratio input.
-
Robust backtesting results in trending markets with sustained directional moves.
-
Automated trade entry, exit and management once coded into a trading platform.
Risks
The main risks to consider:
-
Potential for whipsaw losses in range-bound non-trending markets.
-
Stop loss only accounts for current bar's range, so gaps can cause unwanted liquidations.
-
Difficult to evaluate performance without extensive backtesting across different market conditions.
-
Coding errors could lead to unintended order placement or trade management.
Risks can be mitigated through additional filters, evaluating performance in a robust manner and testing vigorously before live deployment.
Enhancements
Some ways in which this strategy could be enhanced:
-
Adding filters such as volume, RSI or MACD to improve timing and accuracy of signals.
-
Optimizing Bollinger Bands lengths or standard deviation multiples for specific instruments.
-
Using different risk-reward ratios per market based on backtest expectation.
-
Incorporating adaptive stops that trail price once profitable.
-
Building as an algorithm with automated walking of orders upon entry.
Careful optimization and security selection will be key to successfully implementing this strategy in live markets.
Conclusion
The Bollinger Bands Breakout Trend Trading Strategy offers a rules-based approach to entering into emerging trends across various markets. By combining adaptive bands that account for volatility and early breakout signals, it aims to capture moves as momentum accelerates. However, like all systematic strategies, it will require robust historical analysis and risk management to account for regime changes over market cycles.
- 1